the graph of a function f is shown below. use the graph of the function to find its average rate of change…
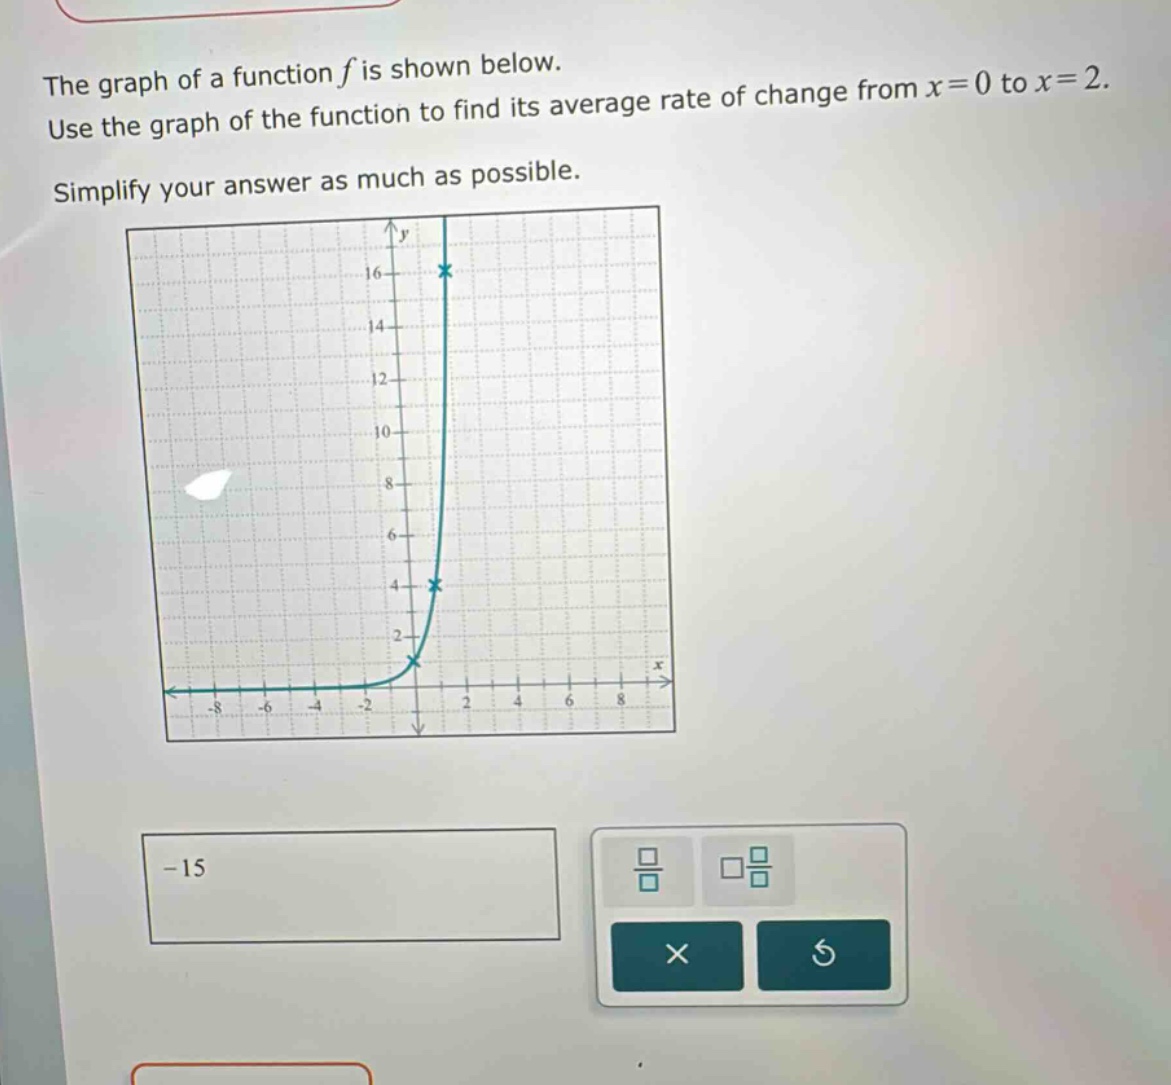
the graph of a function f is shown below. use the graph of the function to find its average rate of change from x = 0 to x = 2. simplify your answer as much as possible.
Answer
Explanation:
Step1: Recall average - rate - of - change formula
The average rate of change of a function $y = f(x)$ from $x=a$ to $x = b$ is $\frac{f(b)-f(a)}{b - a}$. Here, $a = 0$, $b = 2$.
Step2: Find $f(0)$ and $f(2)$ from the graph
From the graph, when $x = 0$, $f(0)=4$; when $x = 2$, $f(2)=16$.
Step3: Calculate the average rate of change
Substitute into the formula: $\frac{f(2)-f(0)}{2 - 0}=\frac{16 - 4}{2}=\frac{12}{2}=6$.
Answer:
6