graph the function f(x) = -sin(x).
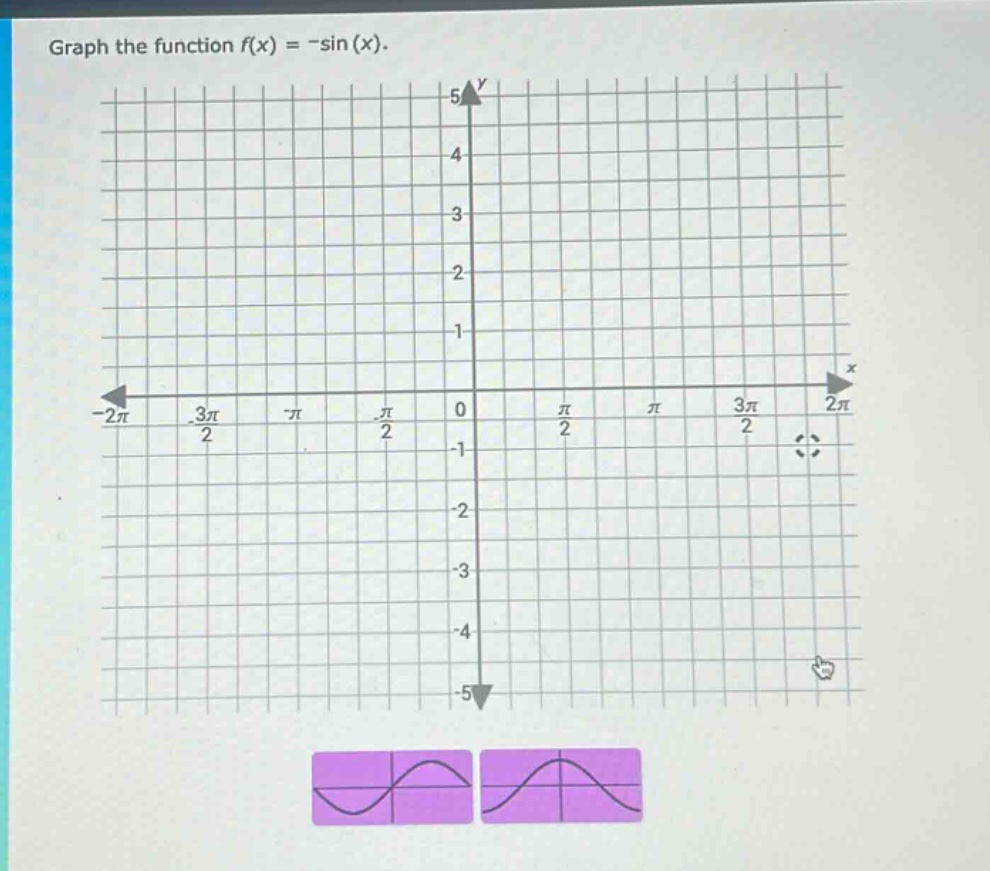
graph the function f(x) = -sin(x).
Answer
Explanation:
Step1: Recall properties of y = sin(x)
The function $y = \sin(x)$ has a period of $2\pi$, amplitude of 1, and passes through points $(0,0),(\frac{\pi}{2},1),(\pi,0),(\frac{3\pi}{2}, - 1),(2\pi,0)$.
Step2: Analyze y=-sin(x)
The negative sign in $y =-\sin(x)$ reflects the graph of $y=\sin(x)$ about the x - axis. So the points become $(0,0),(\frac{\pi}{2},-1),(\pi,0),(\frac{3\pi}{2},1),(2\pi,0)$.
Step3: Plot key - points
Plot the points $(0,0),(\frac{\pi}{2},-1),(\pi,0),(\frac{3\pi}{2},1),(2\pi,0)$ on the given coordinate grid.
Step4: Draw the curve
Connect the points with a smooth curve. Since the period is $2\pi$, the pattern repeats every $2\pi$ units along the x - axis.
Answer:
Graph the points $(0,0),(\frac{\pi}{2},-1),(\pi,0),(\frac{3\pi}{2},1),(2\pi,0)$ and connect them with a smooth curve that repeats every $2\pi$ units along the x - axis.