graph the function f(x) = 2 sin (x).
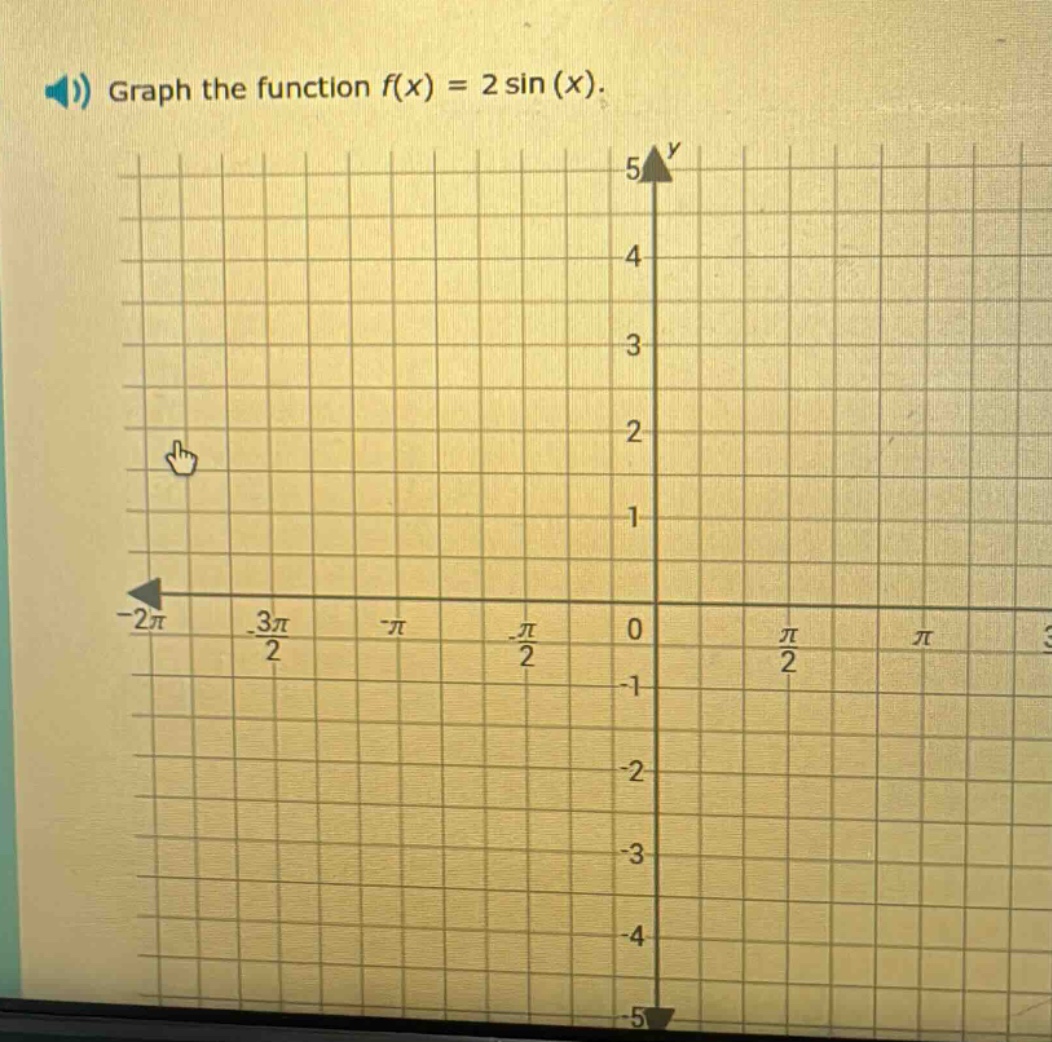
graph the function f(x) = 2 sin (x).
Answer
Explanation:
Step1: Recall properties of sine - function
The general form of a sine - function is $y = A\sin(Bx - C)+D$. For the function $y = 2\sin(x)$, $A = 2$, $B = 1$, $C = 0$, and $D = 0$. The amplitude is $|A|=2$, the period is $T=\frac{2\pi}{|B|}=2\pi$, the phase - shift is $\frac{C}{B}=0$, and the vertical shift is $D = 0$.
Step2: Find key points
For the sine function $y=\sin(x)$, key points in one period $[0, 2\pi]$ are $(0,0)$, $(\frac{\pi}{2},1)$, $(\pi,0)$, $(\frac{3\pi}{2}, - 1)$, $(2\pi,0)$. For $y = 2\sin(x)$, we multiply the $y$ - values of these key points by 2. So the key points are $(0,0)$, $(\frac{\pi}{2},2)$, $(\pi,0)$, $(\frac{3\pi}{2},-2)$, $(2\pi,0)$.
Step3: Plot the points and draw the graph
Plot the key points $(0,0)$, $(\frac{\pi}{2},2)$, $(\pi,0)$, $(\frac{3\pi}{2},-2)$, $(2\pi,0)$ on the given coordinate grid. Then, since the period is $2\pi$, we can repeat the pattern of the graph to the left and right of the interval $[0,2\pi]$. Connect the points with a smooth curve to get the graph of $y = 2\sin(x)$.
Answer:
The graph of $y = 2\sin(x)$ has an amplitude of 2, a period of $2\pi$, passes through the key - points $(0,0)$, $(\frac{\pi}{2},2)$, $(\pi,0)$, $(\frac{3\pi}{2},-2)$, $(2\pi,0)$ in one period $[0,2\pi]$, and is a smooth, periodic curve. (Note: A visual graph cannot be directly provided in this text - based format, but the steps above describe how to create it on the given grid).