graph the function f(x) = sin(x).
graph the function f(x) = sin(x).
Answer
Explanation:
Step1: Identify key points
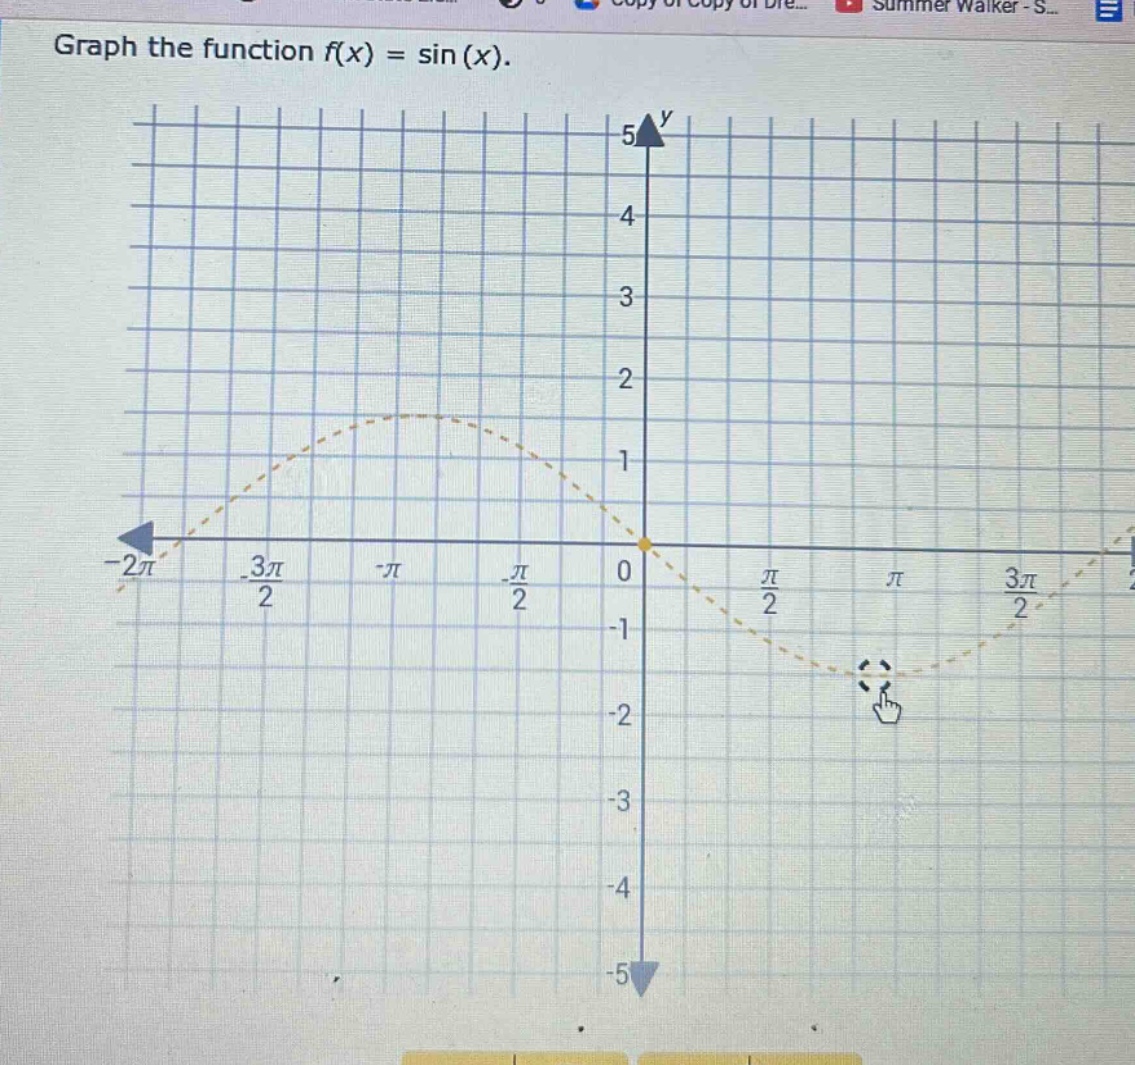
The sine - function (y = \sin(x)) has a period of (2\pi). Key points in one period ([0,2\pi]) are ((0,0)), ((\frac{\pi}{2},1)), ((\pi,0)), ((\frac{3\pi}{2}, - 1)), ((2\pi,0)).
Step2: Consider the domain
The domain of (y=\sin(x)) is all real numbers, ((-\infty,\infty)).
Step3: Plot the points and draw the curve
Plot the key - points and then draw a smooth curve that repeats every (2\pi) units. The range of (y = \sin(x)) is ([-1,1]), and the function is symmetric about the origin (it is an odd function, (\sin(-x)=-\sin(x))).
Answer:
The graph of (y = \sin(x)) is a periodic wave - like curve that oscillates between (y=-1) and (y = 1) with a period of (2\pi), passing through the points ((0,0)), ((\frac{\pi}{2},1)), ((\pi,0)), ((\frac{3\pi}{2}, - 1)), ((2\pi,0)) and repeating these values for (x\in(-\infty,\infty)).