graph the function f(x) = sin(x) - 2.
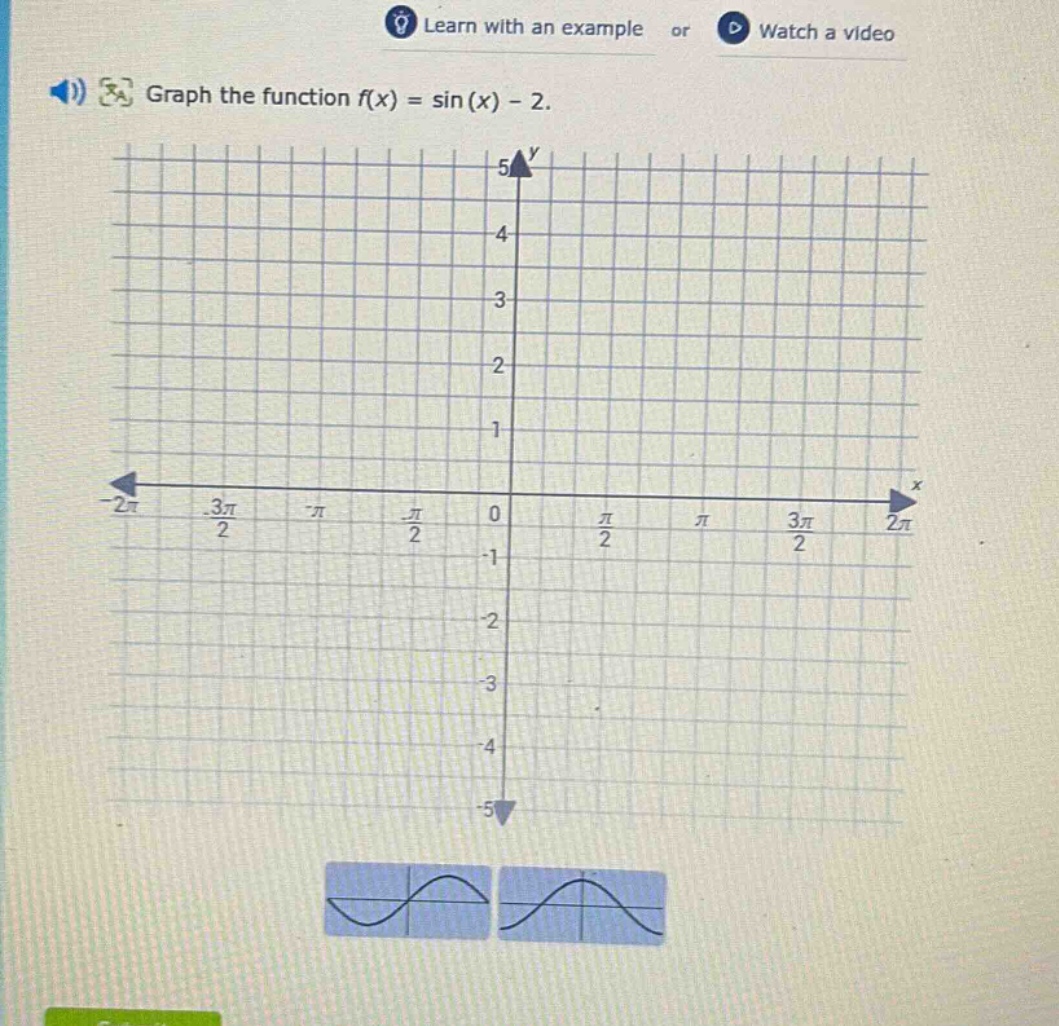
graph the function f(x) = sin(x) - 2.
Answer
Answer:
To graph $y = \sin(x)-2$, we can use the following steps to plot key - points and draw the curve:
- Recall the properties of the basic sine function $y = \sin(x)$. The amplitude of $y=\sin(x)$ is $A = 1$, the period is $T=2\pi$, and the range is $[- 1,1]$.
- For the function $y=\sin(x)-2$, it is a vertical shift of the function $y = \sin(x)$ down by 2 units.
- Find the key - points:
- When $x = 0$, $y=\sin(0)-2=0 - 2=-2$.
- When $x=\frac{\pi}{2}$, $y=\sin(\frac{\pi}{2})-2=1 - 2=-1$.
- When $x=\pi$, $y=\sin(\pi)-2=0 - 2=-2$.
- When $x=\frac{3\pi}{2}$, $y=\sin(\frac{3\pi}{2})-2=-1 - 2=-3$.
- When $x = 2\pi$, $y=\sin(2\pi)-2=0 - 2=-2$.
- Plot these key - points on the coordinate plane and connect them with a smooth curve. The period of $y=\sin(x)-2$ is still $2\pi$, and the range is $[-3,-1]$.
Explanation:
Step1: Recall basic sine function
The basic $\sin(x)$ has amplitude 1, period $2\pi$.
Step2: Identify vertical shift
The $-2$ shifts $\sin(x)$ down 2 units.
Step3: Calculate key - points
Evaluate $y=\sin(x)-2$ at $x = 0,\frac{\pi}{2},\pi,\frac{3\pi}{2},2\pi$.
Step4: Plot and draw
Plot points and draw a smooth sine - like curve.