graph the function $y = 3 \\sin(3x)$. click and drag the highlighted points to shift the graph and to adjust…
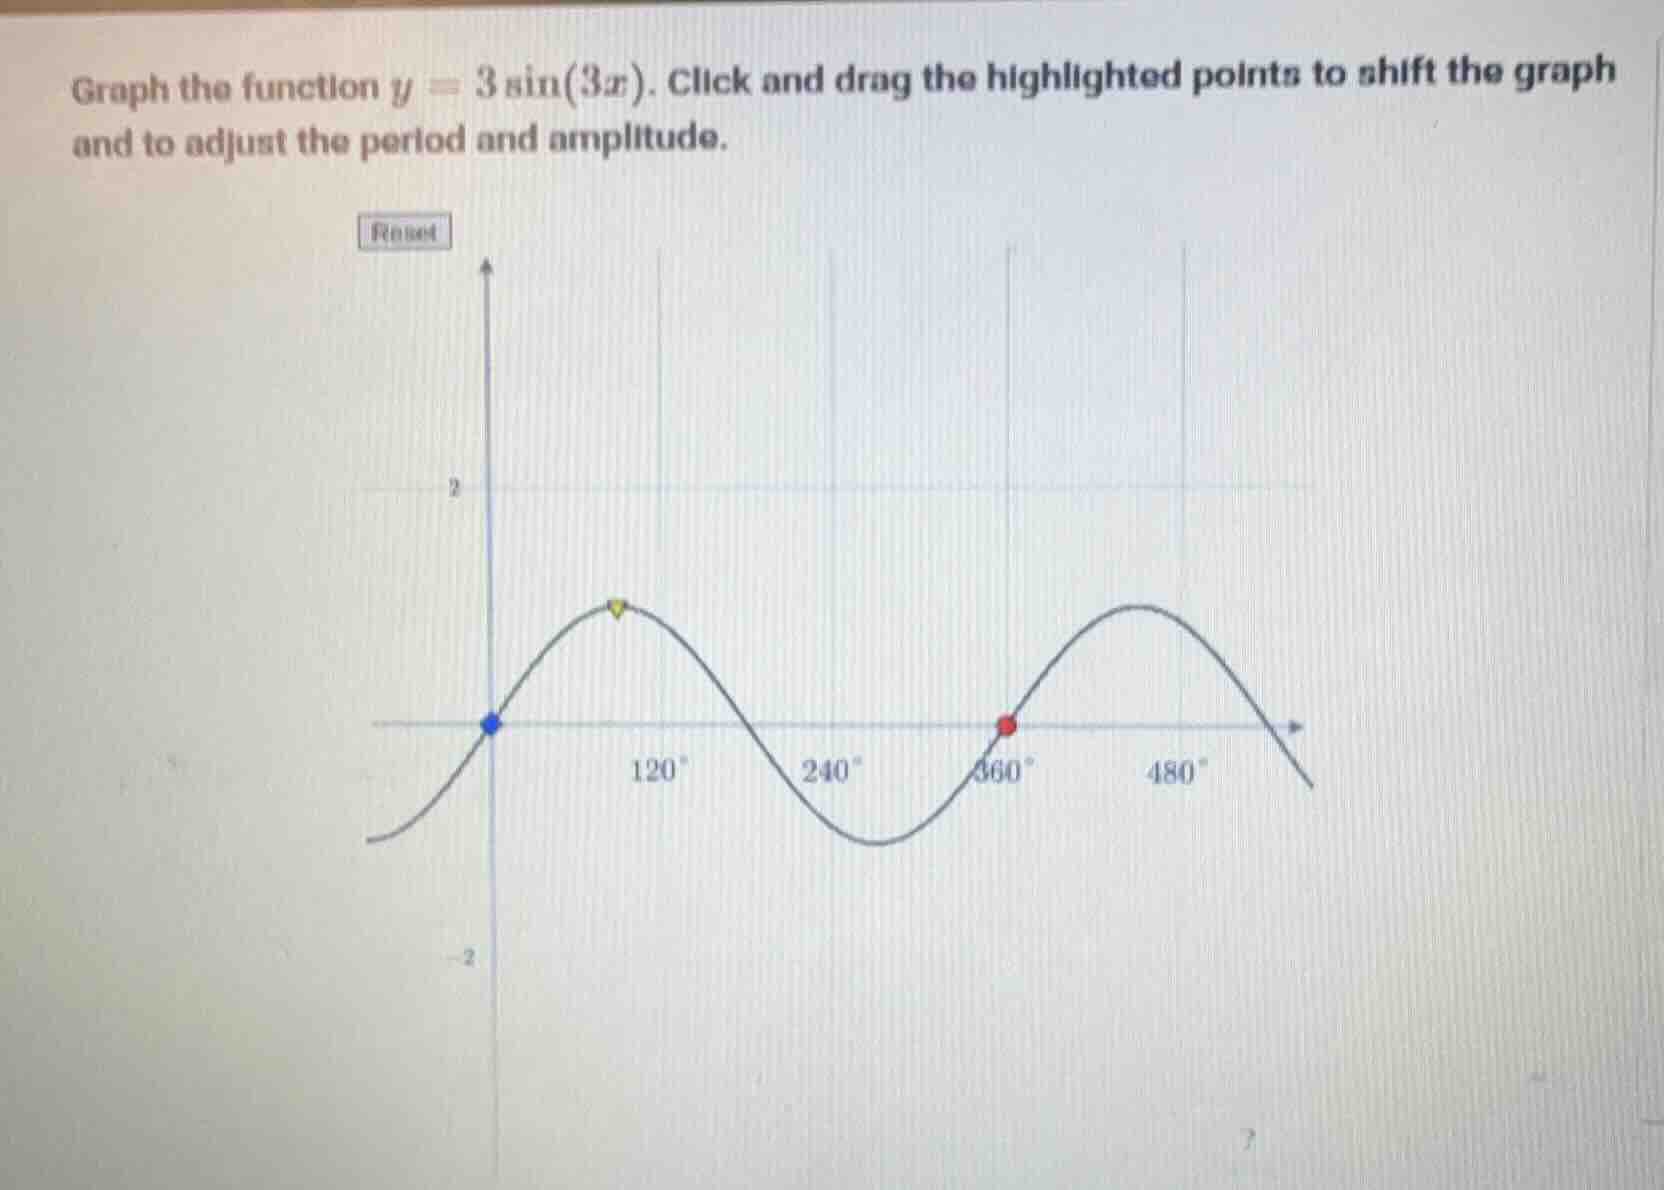
graph the function $y = 3 \\sin(3x)$. click and drag the highlighted points to shift the graph and to adjust the period and amplitude.
Answer
Explanation:
Step1: Identify the amplitude
The amplitude $A$ is the coefficient of the sine function. $$|A| = 3$$
Step2: Determine the period in degrees
The period $P$ for $\sin(bx)$ is $\frac{360^{\circ}}{b}$. Here $b = 3$. $$P = \frac{360^{\circ}}{3} = 120^{\circ}$$
Step3: Locate key points for one cycle
A sine wave $y = 3\sin(3x)$ starts at $(0,0)$, reaches a peak at $\frac{P}{4}$, returns to zero at $\frac{P}{2}$, reaches a trough at $\frac{3P}{4}$, and completes the cycle at $P$. $$x_{peak} = \frac{120^{\circ}}{4} = 30^{\circ}, \quad x_{intercept} = \frac{120^{\circ}}{2} = 60^{\circ}, \quad x_{end} = 120^{\circ}$$
Step4: Define coordinates for graphing
The maximum point is $(30^{\circ}, 3)$ and the first full period ends at $(120^{\circ}, 0)$.
Answer:
To graph $y = 3\sin(3x)$, set the amplitude to 3 (peak at $y=3$, trough at $y=-3$) and the period to $120^{\circ}$. The graph should pass through $(0,0)$, have a maximum at $(30^{\circ}, 3)$, an x-intercept at $(60^{\circ}, 0)$, a minimum at $(90^{\circ}, -3)$, and complete one full cycle at $(120^{\circ}, 0)$.