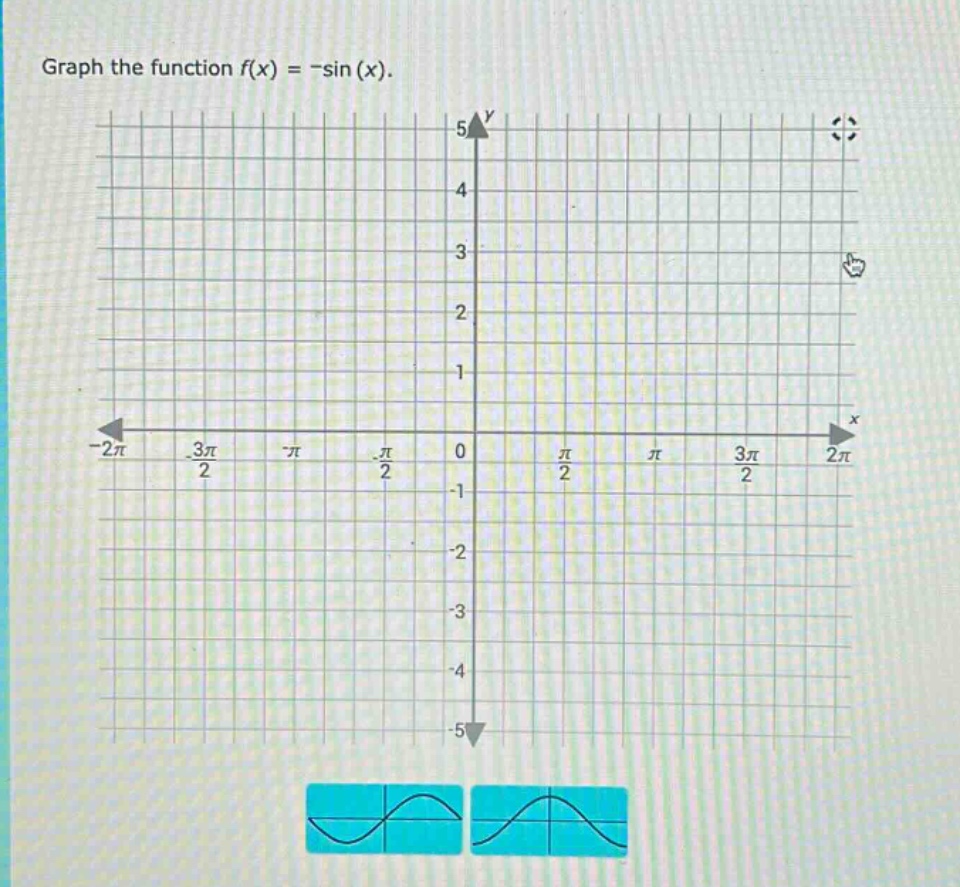
graph the function f(x) = -sin (x).
graph the function f(x) = -sin (x).
Answer
Explanation:
Step1: Identify the base function and transformation.
The function is $f(x) = -\sin(x)$. This is a reflection of the base function $y = \sin(x)$ across the x-axis.
Step2: Find key points for $y = \sin(x)$ over one period $[0, 2\pi]$.
Key points are $(0, 0)$, $(\frac{\pi}{2}, 1)$, $(\pi, 0)$, $(\frac{3\pi}{2}, -1)$, $(2\pi, 0)$.
Step3: Apply the reflection to find key points for $f(x) = -\sin(x)$.
Multiply the y-coordinates by -1: $(0, -1 \times 0) = (0, 0)$ $(\frac{\pi}{2}, -1 \times 1) = (\frac{\pi}{2}, -1)$ $(\pi, -1 \times 0) = (\pi, 0)$ $(\frac{3\pi}{2}, -1 \times -1) = (\frac{3\pi}{2}, 1)$ $(2\pi, -1 \times 0) = (2\pi, 0)$
Step4: Plot the key points and draw a smooth curve.
Plot $(0, 0)$, $(\frac{\pi}{2}, -1)$, $(\pi, 0)$, $(\frac{3\pi}{2}, 1)$, $(2\pi, 0)$. Connect these points with a sinusoidal curve. The graph starts at the origin, goes down to a minimum at $x=\frac{\pi}{2}$, crosses the x-axis at $x=\pi$, reaches a maximum at $x=\frac{3\pi}{2}$, and returns to the x-axis at $x=2\pi$.
Step5: Extend the graph periodically.
The function has a period of $2\pi$. Repeat the pattern from Step 4 to the left and right as needed for the given domain $[-2\pi, 2\pi]$. Key points in $[-2\pi, 0]$ include $(-2\pi, 0)$, $(-\frac{3\pi}{2}, -1)$, $(-\pi, 0)$, $(-\frac{\pi}{2}, 1)$.
Answer:
The graph of $f(x) = -\sin(x)$ is a sinusoidal curve that passes through the following key points: $(-2\pi, 0)$, $(-\frac{3\pi}{2}, -1)$, $(-\pi, 0)$, $(-\frac{\pi}{2}, 1)$, $(0, 0)$, $(\frac{\pi}{2}, -1)$, $(\pi, 0)$, $(\frac{3\pi}{2}, 1)$, $(2\pi, 0)$. The graph oscillates between $y=-1$ and $y=1$ with a period of $2\pi$. It is a reflection of the standard sine curve across the x-axis.
(The graph should be plotted on the provided coordinate system, matching the shape described by these points, similar to the first template graph shown in the original image.)