graph the function f(x) = sin(x) - 1.
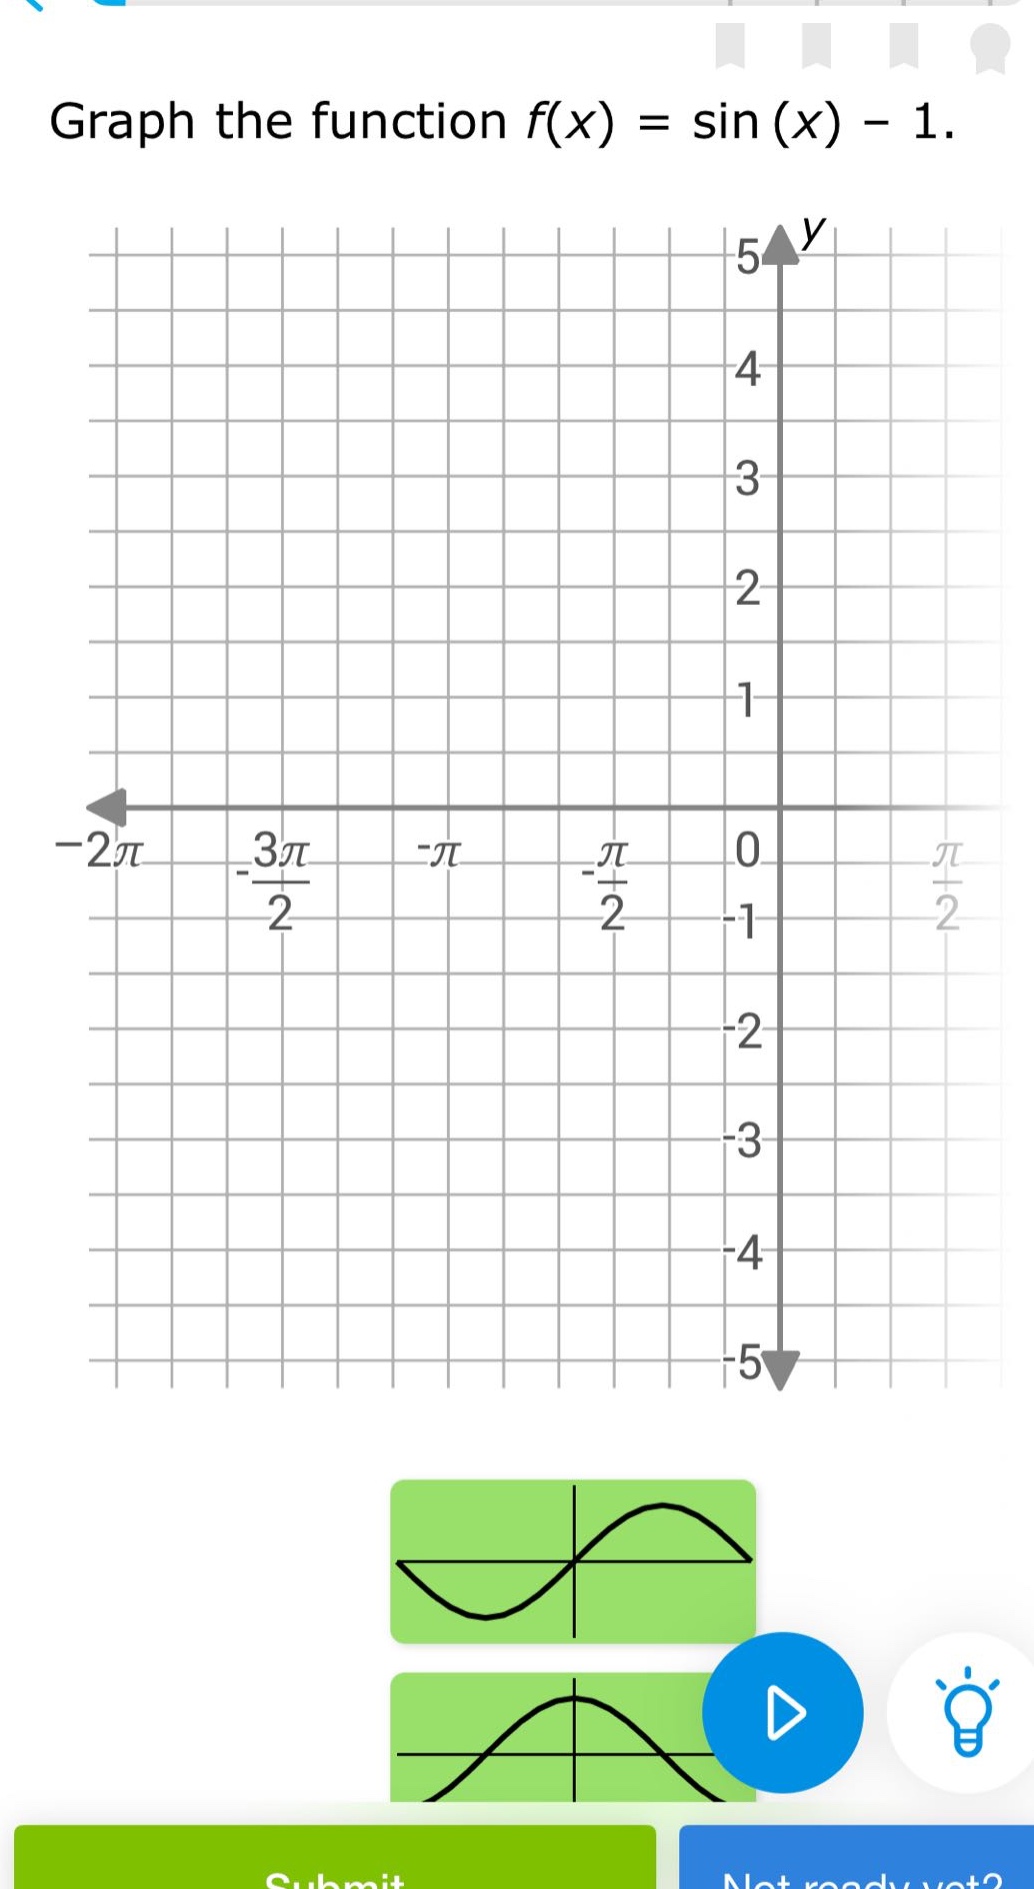
graph the function f(x) = sin(x) - 1.
Answer
Explanation:
Step1: Recall properties of y = sin(x)
The function $y = \sin(x)$ has an amplitude of 1, a period of $2\pi$, and its range is $[- 1,1]$. It has a maximum value of 1 at $x=\frac{\pi}{2}+2k\pi,k\in\mathbb{Z}$ and a minimum value of - 1 at $x = \frac{3\pi}{2}+2k\pi,k\in\mathbb{Z}$, and it passes through the origin $(0,0)$.
Step2: Analyze transformation of f(x)=sin(x) - 1
The transformation $y=\sin(x)-1$ is a vertical shift of the graph of $y = \sin(x)$ down by 1 unit. The amplitude remains 1 and the period remains $2\pi$. The new range is $[-2,0]$. The maximum value of $y=\sin(x)-1$ is 0 (when $\sin(x)=1$, i.e., $x = \frac{\pi}{2}+2k\pi,k\in\mathbb{Z}$) and the minimum value is - 2 (when $\sin(x)=-1$, i.e., $x=\frac{3\pi}{2}+2k\pi,k\in\mathbb{Z}$). When $x = 0$, $y=\sin(0)-1=-1$.
Step3: Plot key - points
Plot the key - points:
- When $x = 0$, $y=-1$.
- When $x=\frac{\pi}{2}$, $y = 0$.
- When $x=\pi$, $y=-1$.
- When $x=\frac{3\pi}{2}$, $y=-2$.
- When $x = 2\pi$, $y=-1$. Then connect these points with a smooth curve that repeats every $2\pi$ units.
Answer:
The graph of $y = \sin(x)-1$ is a sine - wave with amplitude 1, period $2\pi$, range $[-2,0]$, shifted 1 unit down from the graph of $y=\sin(x)$. Key - points include $(0, - 1),(\frac{\pi}{2},0),(\pi,-1),(\frac{3\pi}{2},-2),(2\pi,-1)$ and the graph repeats every $2\pi$ units.