graph the function.\n$y = 4 + \\sqrt{x}$\nclick to plot points on the graph. plot the endpoint first.
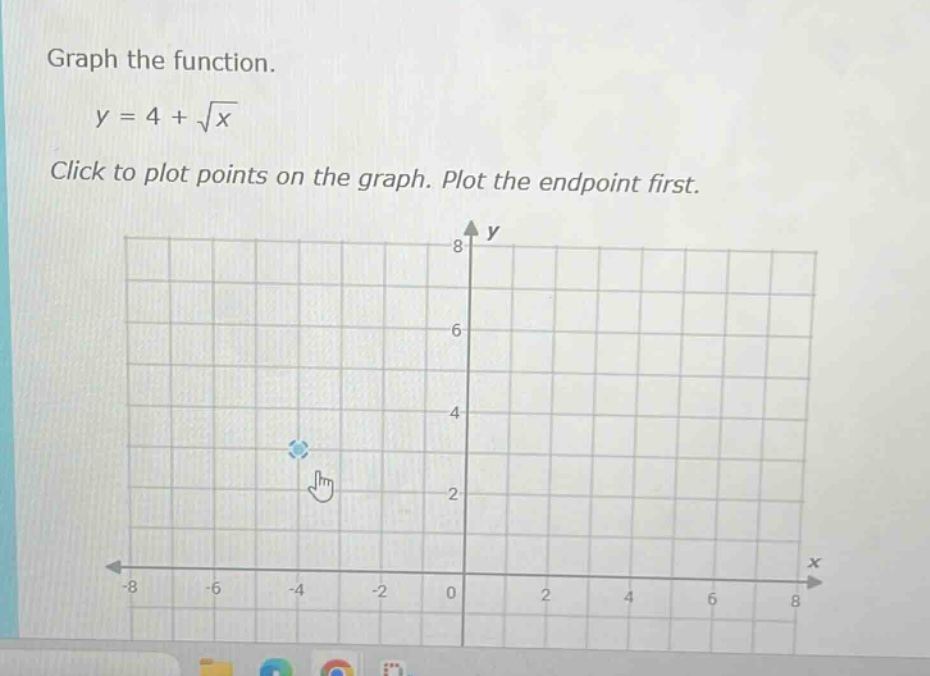
graph the function.\n$y = 4 + \\sqrt{x}$\nclick to plot points on the graph. plot the endpoint first.
Answer
Answer:
The graph starts at (0, 4) and curves upward as x increases.
Explanation:
Step 1: Determine the domain
$x \geq 0$ (since square root of negative numbers is undefined in real numbers).
Step 2: Find the endpoint
At $x = 0$, $y = 4 + \sqrt{0} = 4$. Endpoint is $(0, 4)$.
Step 3: Calculate additional points
For $x = 1$, $y = 4 + 1 = 5$ → $(1, 5)$.
For $x = 4$, $y = 4 + 2 = 6$ → $(4, 6)$.
For $x = 9$, $y = 4 + 3 = 7$ → $(9, 7)$.
Step 4: Plot and connect points
Plot endpoint $(0, 4)$ first, then additional points, and draw a smooth curve through them, extending to the right.