which is the graph of the function y = -tan(x)?
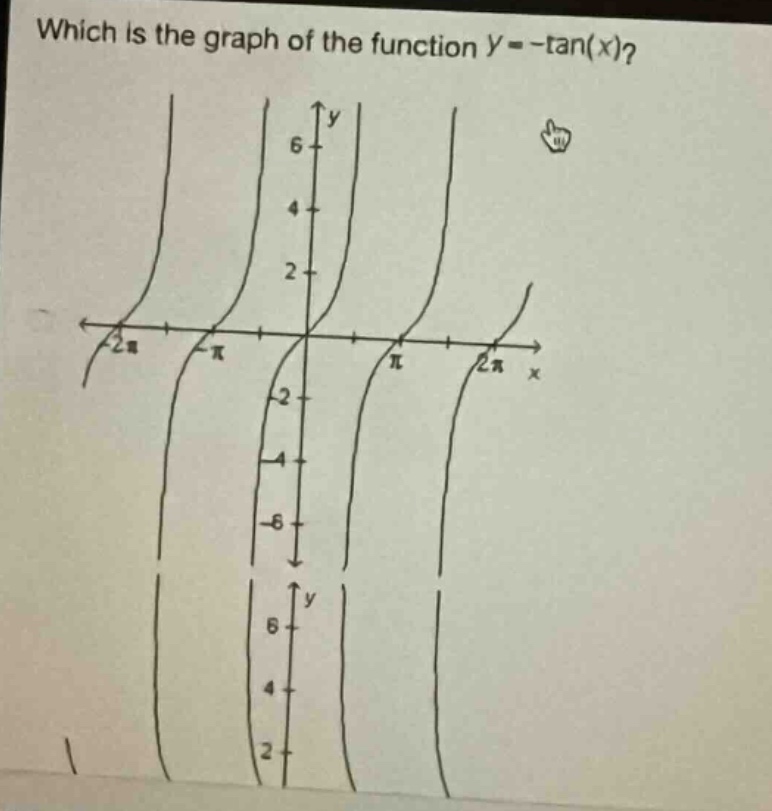
which is the graph of the function y = -tan(x)?
Answer
Explanation:
Step1: Recall tangent - function properties
The function (y = \tan(x)) has vertical asymptotes at (x=\frac{\pi}{2}+k\pi), (k\in\mathbb{Z}), and passes through the origin ((0,0)). It is an odd - function with a period of (\pi).
Step2: Analyze the effect of the negative sign
The negative sign in (y =-\tan(x)) reflects the graph of (y = \tan(x)) about the (x) - axis. When (y=\tan(x)) is increasing, (y =-\tan(x)) is decreasing. For example, in the interval ((-\frac{\pi}{2},\frac{\pi}{2})), (y = \tan(x)) is increasing from (-\infty) to (\infty), while (y=-\tan(x)) is decreasing from (\infty) to (-\infty).
Answer:
The graph of (y =-\tan(x)) is the graph of (y = \tan(x)) reflected about the (x) - axis, with vertical asymptotes at (x=\frac{\pi}{2}+k\pi), (k\in\mathbb{Z}), and passing through the origin ((0,0)).