graph the function by using transformations of the graph of y = 1/x². plot all necessary asymptotes. for…
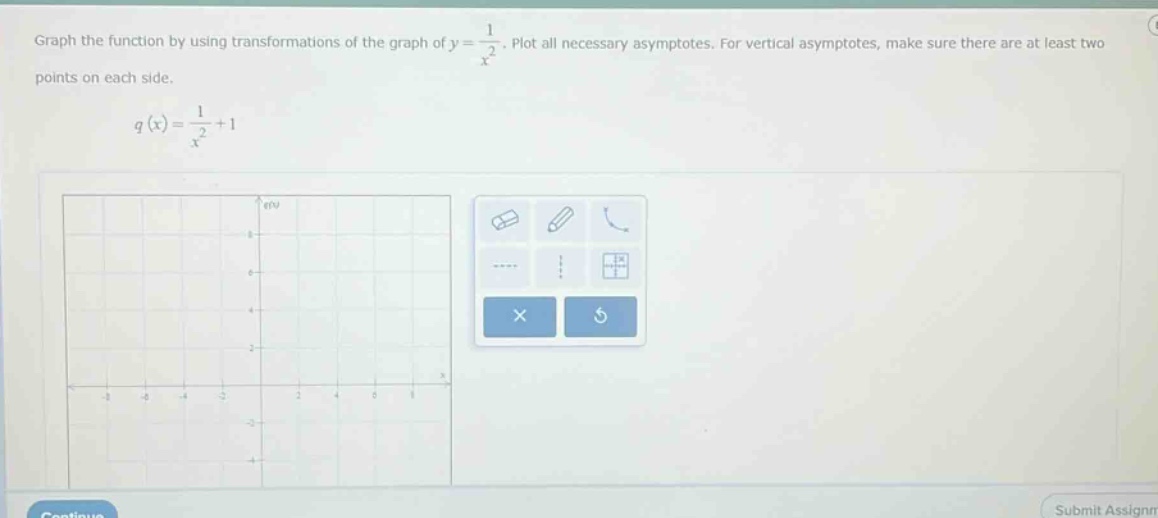
graph the function by using transformations of the graph of y = 1/x². plot all necessary asymptotes. for vertical asymptotes, make sure there are at least two points on each side. q(x)=1/x² + 1
Answer
Explanation:
Step1: Identify the base - function properties
The base function is $y = \frac{1}{x^{2}}$. It has a vertical asymptote at $x = 0$ and a horizontal asymptote at $y = 0$.
Step2: Analyze the transformation
The function $q(x)=\frac{1}{x^{2}}+1$ is a vertical shift of the function $y = \frac{1}{x^{2}}$ up by 1 unit.
Step3: Find the asymptotes of the new function
The vertical asymptote remains at $x = 0$ since the denominator is still zero at $x = 0$. The horizontal asymptote is now at $y = 1$ because of the vertical shift.
Step4: Select points to plot
For $x=-2$, $q(-2)=\frac{1}{(-2)^{2}}+1=\frac{1}{4}+1=\frac{5}{4} = 1.25$. For $x = - 1$, $q(-1)=\frac{1}{(-1)^{2}}+1=2$. For $x = 1$, $q(1)=\frac{1}{1^{2}}+1=2$. For $x = 2$, $q(2)=\frac{1}{2^{2}}+1=\frac{1}{4}+1=\frac{5}{4}=1.25$.
To graph:
- Draw the vertical asymptote $x = 0$ as a dashed line.
- Draw the horizontal asymptote $y = 1$ as a dashed line.
- Plot the points $(-2,1.25),(-1,2),(1,2),(2,1.25)$ and sketch the curve approaching the asymptotes.
Answer:
Graph the vertical asymptote $x = 0$ and horizontal asymptote $y = 1$ as dashed lines. Plot points $(-2,1.25),(-1,2),(1,2),(2,1.25)$ and sketch the curve approaching the asymptotes.