if the graph increases to the right, you have a rate of change.\nif the graph decreases to the right, you…
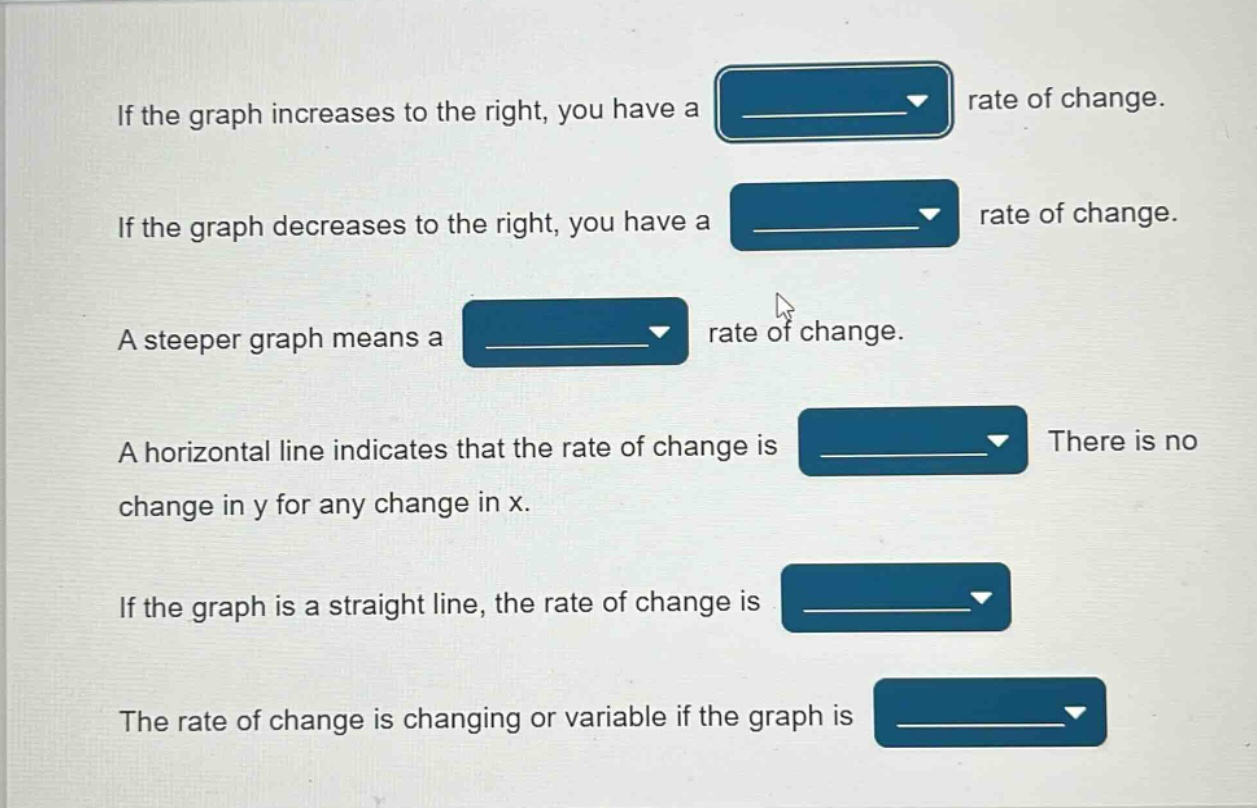
if the graph increases to the right, you have a rate of change.\nif the graph decreases to the right, you have a rate of change.\na steeper graph means a rate of change.\na horizontal line indicates that the rate of change is there is no change in y for any change in x.\nif the graph is a straight line, the rate of change is \nthe rate of change is changing or variable if the graph is
Answer
Brief Explanations:
- When a graph increases to the right, the slope (rate of change) is positive as the y - values increase with increasing x - values.
- When a graph decreases to the right, the slope (rate of change) is negative as y - values decrease with increasing x - values.
- A steeper graph has a larger absolute - value of the slope, indicating a greater rate of change.
- A horizontal line has a slope of 0 since there is no vertical change (change in y) for any horizontal change (change in x).
- For a straight - line graph, the slope is constant throughout, so the rate of change is constant.
- If the graph is a curve, the slope (rate of change) is different at different points, so it is changing or variable.
Answer:
- Positive
- Negative
- Greater
- Zero
- Constant
- A curve