graph this inequality: \n$y \\geq -\\frac{7}{6}x$\nplot points on the boundary line. select the line to…
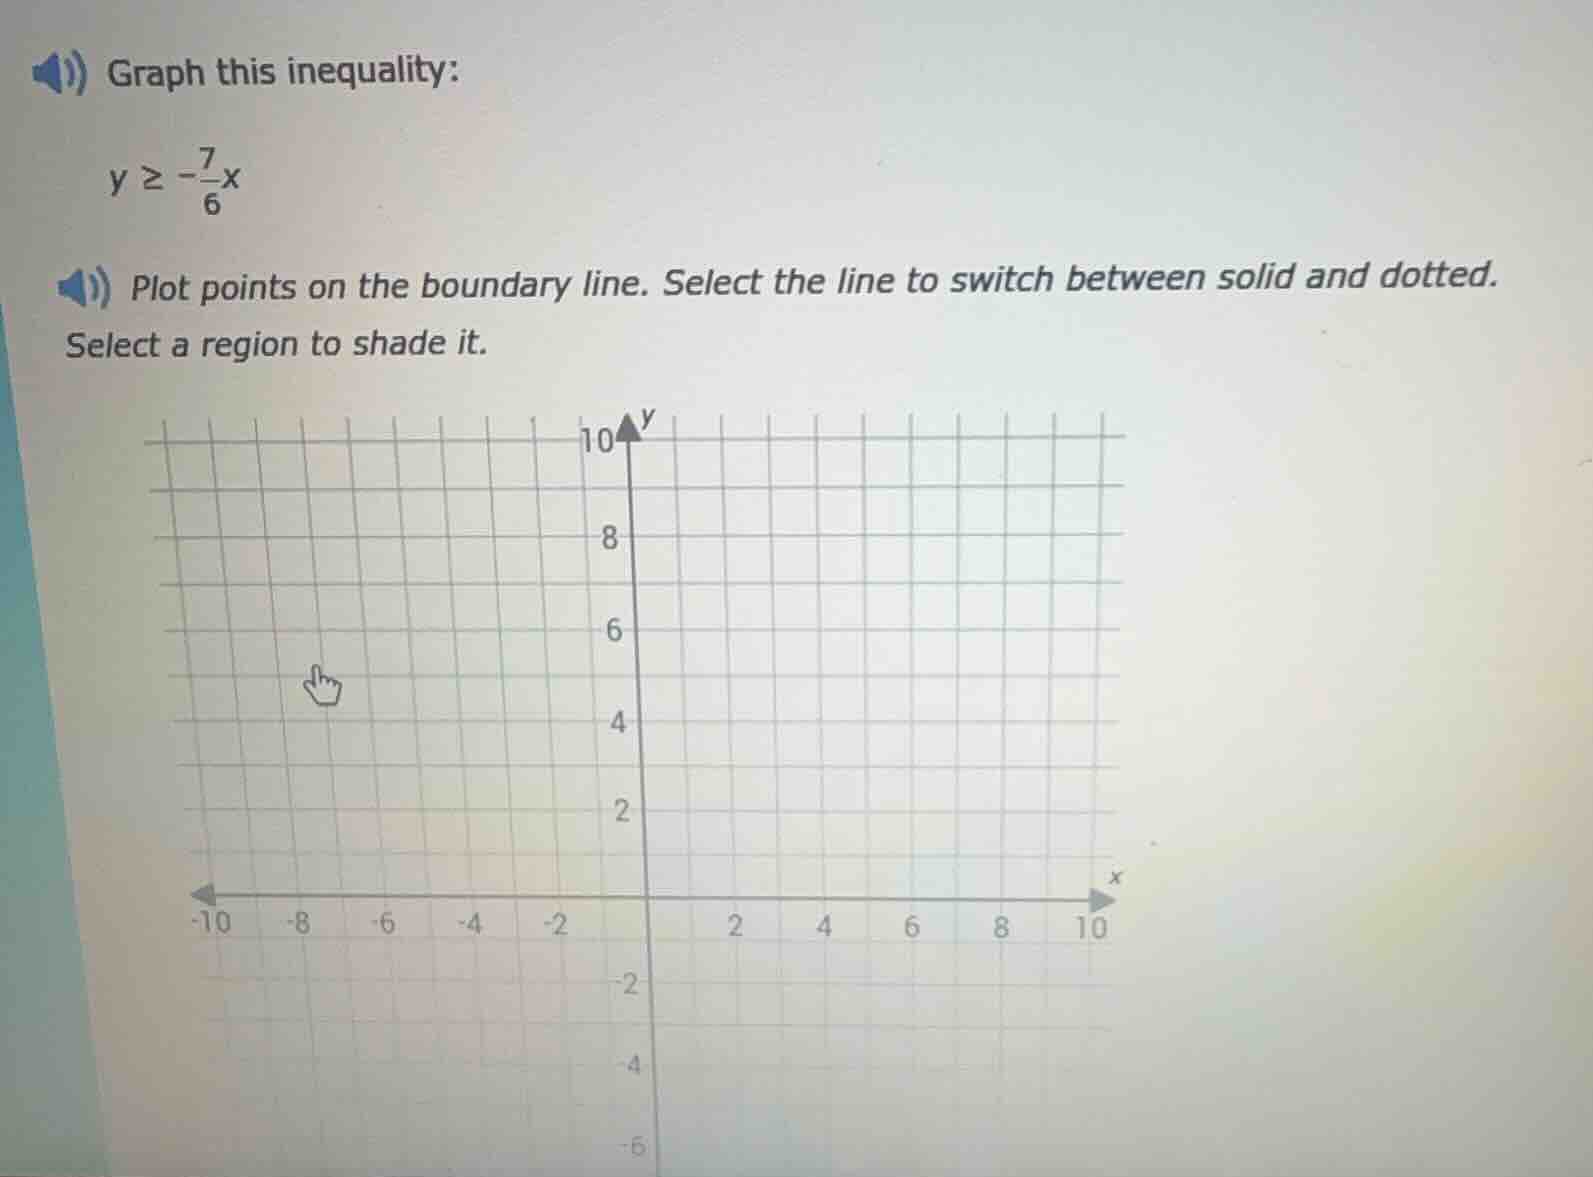
graph this inequality: \n$y \\geq -\\frac{7}{6}x$\nplot points on the boundary line. select the line to switch between solid and dotted. select a region to shade it.
Answer
Explanation:
Step1: Identify the boundary line type
The inequality is ( y \geq -\frac{7}{6}x ). Since the inequality is "greater than or equal to", the boundary line will be solid (because the equality is included).
Step2: Find two points on the boundary line
The equation of the boundary line is ( y = -\frac{7}{6}x ).
- When ( x = 0 ), ( y = -\frac{7}{6}(0)=0 ). So one point is ( (0, 0) ).
- When ( x = 6 ), ( y = -\frac{7}{6}(6)= -7 ). Wait, that's a negative y - value. Let's choose ( x=-6 ) instead. When ( x = -6 ), ( y=-\frac{7}{6}(-6) = 7 ). So another point is ( (-6, 7) ).
Step3: Plot the points and draw the line
Plot the points ( (0, 0) ) and ( (-6, 7) ) on the coordinate plane. Since the boundary line is solid, draw a solid line through these two points.
Step4: Determine the region to shade
To determine which region to shade, we can test a point not on the line. Let's choose the point ( (0, 1) ) (which is above the line ( y = -\frac{7}{6}x ) since when ( x = 0 ), ( y = 0 ) and ( 1\geq0 )). Substitute ( x = 0 ) and ( y = 1 ) into the inequality ( y\geq-\frac{7}{6}x ): ( 1\geq-\frac{7}{6}(0)) which simplifies to ( 1\geq0 ), which is true. So we shade the region that contains the point ( (0, 1) ), which is the region above the solid line ( y = -\frac{7}{6}x ).
(Note: Since the problem asks to graph, the final answer is the graph with a solid line through ( (0,0) ) and ( (-6,7) ) (or other valid points) and the region above the line shaded.)
Answer:
The boundary line is solid, passing through points like ( (0, 0) ) and ( (-6, 7) ), and the region above the line is shaded. (Graph description: solid line ( y = -\frac{7}{6}x ) with the area above it shaded)