graph the logarithmic function.\ng(x)=log_{1/2}x\nplot two points on the graph of the function, and also…
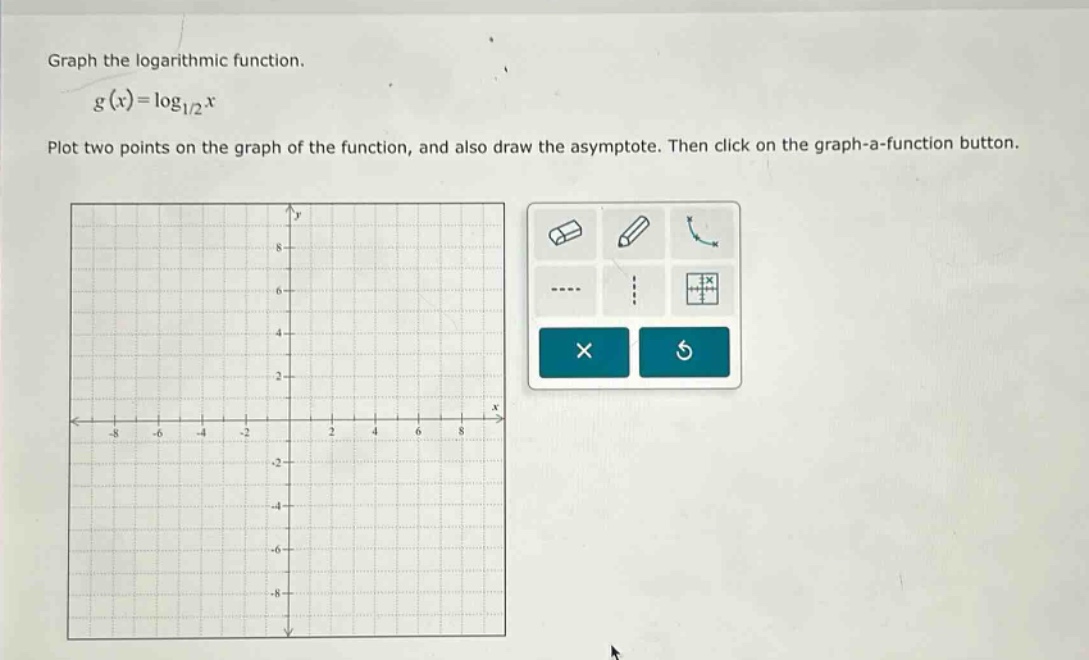
graph the logarithmic function.\ng(x)=log_{1/2}x\nplot two points on the graph of the function, and also draw the asymptote. then click on the graph - a - function button.
Answer
Explanation:
Step1: Find the vertical asymptote
For the logarithmic function (y = \log_{a}x), the vertical asymptote is (x = 0). So for (g(x)=\log_{1/2}x), the vertical asymptote is (x = 0).
Step2: Find two points on the graph
- When (x = 1): Substitute (x = 1) into (g(x)=\log_{1/2}x). Using the property (\log_{a}1=0) ((a>0,a\neq1)), we get (g(1)=\log_{1/2}1 = 0). So the point is ((1,0)).
- When (x = 2): Substitute (x = 2) into (g(x)=\log_{1/2}x). Using the formula (\log_{a}b=\frac{\ln b}{\ln a}), we have (g(2)=\log_{1/2}2=\frac{\ln 2}{\ln\frac{1}{2}}=\frac{\ln 2}{-\ln 2}=- 1). So the point is ((2,-1)).
Answer:
Vertical asymptote (x = 0), points ((1,0)) and ((2,-1)) can be plotted on the graph.