graph the logarithmic function (g(x)=-log_{3}x - 1). to do this, plot two points on the graph of the…
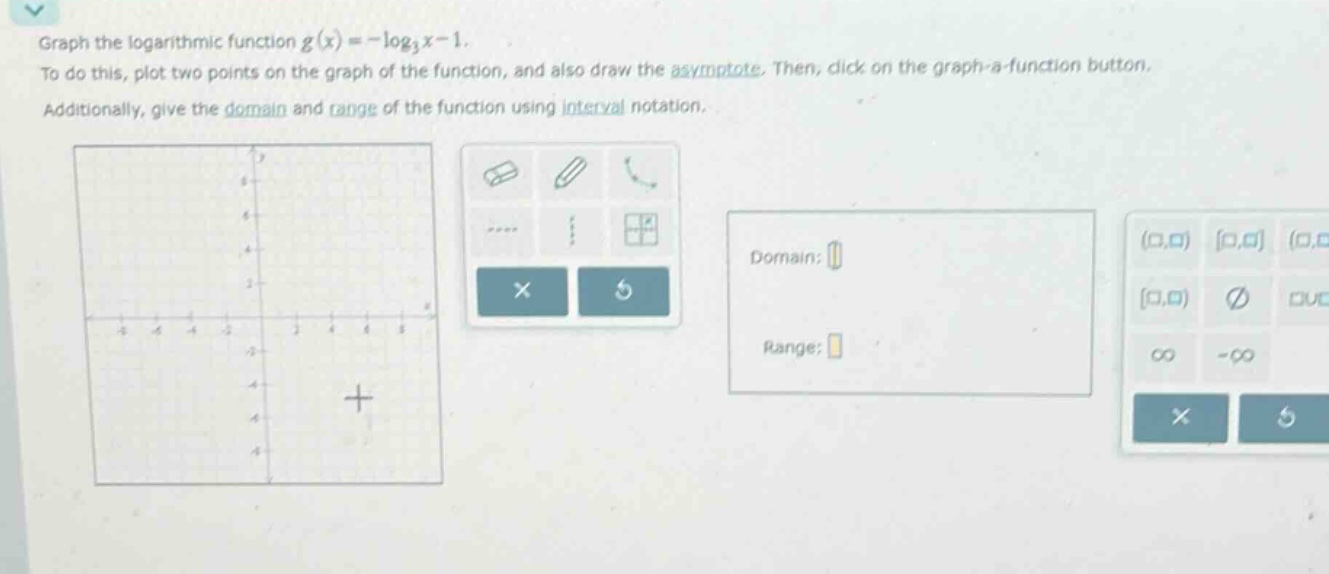
graph the logarithmic function (g(x)=-log_{3}x - 1). to do this, plot two points on the graph of the function, and also draw the asymptote. then, click on the graph - a - function button. additionally, give the domain and range of the function using interval notation.
Answer
Explanation:
Step1: Find two points
For (x = 1), (g(1)=-\log_3(1)-1). Since (\log_3(1) = 0), then (g(1)=- 0 - 1=-1). So the point is ((1,-1)). For (x = 3), (g(3)=-\log_3(3)-1). Since (\log_3(3)=1), then (g(3)=-1 - 1=-2). So the point is ((3,-2)).
Step2: Determine the asymptote
The function (y = \log_3x) has a vertical - asymptote at (x = 0). For the function (g(x)=-\log_3x - 1), the vertical asymptote is also (x = 0).
Step3: Find the domain
The argument of the logarithm function must be positive. For (y =-\log_3x - 1), the domain is (x>0), which in interval notation is ((0,\infty)).
Step4: Find the range
The range of the basic logarithmic function (y = \log_3x) is ((-\infty,\infty)). For (y=-\log_3x - 1), the range is also ((-\infty,\infty)).
Answer:
Two points: ((1,-1)) and ((3,-2)); Asymptote: (x = 0); Domain: ((0,\infty)); Range: ((-\infty,\infty))