graph the logarithmic function. (g(x)=log_{1/3}x). plot two points on the graph of the function, and also…
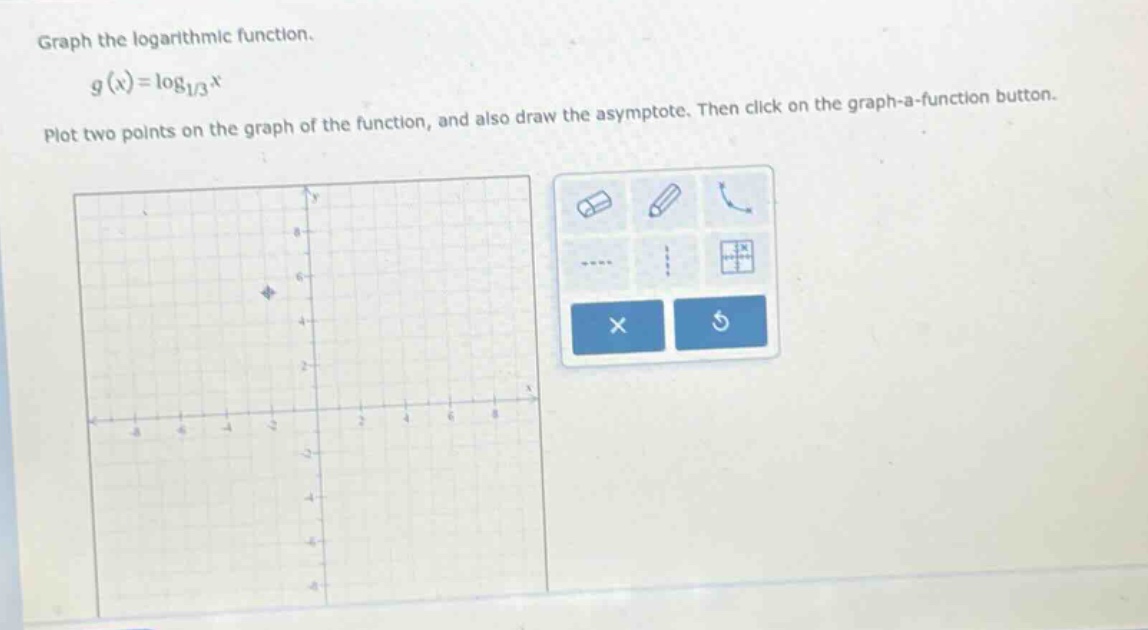
graph the logarithmic function. (g(x)=log_{1/3}x). plot two points on the graph of the function, and also draw the asymptote. then click on the graph - a - function button.
Answer
Explanation:
Step1: Identify the vertical asymptote.
The function is $g(x) = \log_{1/3} x$. The domain of a logarithmic function $\log_b x$ is $x > 0$. The vertical asymptote occurs where the argument of the logarithm is zero. $$x = 0$$ The vertical asymptote is the y-axis.
Step2: Find one point on the graph.
Choose a value for $x$, for example $x=1$. Calculate the corresponding $g(x)$. $$g(1) = \log_{1/3} 1$$ Since any base raised to the power of 0 equals 1, $\log_{1/3} 1 = 0$. So, one point on the graph is $(1, 0)$.
Step3: Find a second point on the graph.
Choose another value for $x$, preferably a power of the base $\frac{1}{3}$. Let's choose $x=3$. $$g(3) = \log_{1/3} 3$$ We need to find the power $y$ such that $(\frac{1}{3})^y = 3$. Since $(\frac{1}{3})^{-1} = 3$, $y = -1$. $$g(3) = -1$$ So, a second point on the graph is $(3, -1)$.
Answer:
The vertical asymptote is the line $x=0$. Two points on the graph are $(1, 0)$ and $(3, -1)$. To graph the function, plot these two points and draw the vertical asymptote $x=0$. Then sketch the logarithmic curve passing through the points and approaching the asymptote. (The user would then plot the points (1,0) and (3,-1), draw the asymptote x=0, and use the graphing tool to draw the curve)