in the graph below, the monthly average temperature in degrees fahrenheit from january to december in a city…
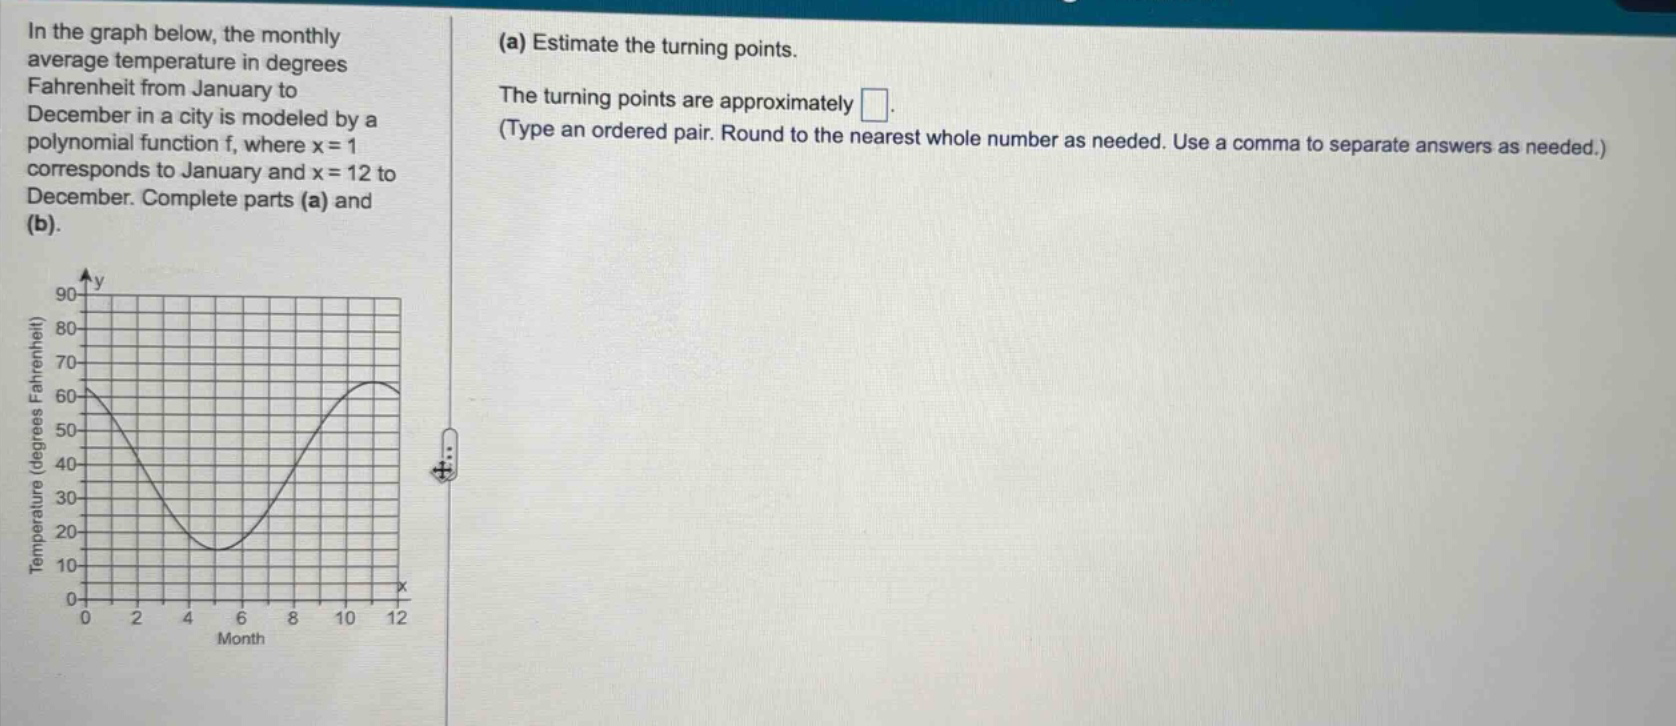
in the graph below, the monthly average temperature in degrees fahrenheit from january to december in a city is modeled by a polynomial function f, where x = 1 corresponds to january and x = 12 to december. complete parts (a) and (b). (a) estimate the turning points. the turning points are approximately . (type an ordered pair. round to the nearest whole number as needed. use a comma to separate answers as needed.)
Answer
Explanation:
Step1: Identify turning - point concept
Turning points are where the graph changes from increasing to decreasing or vice - versa.
Step2: Observe the graph
In the given graph of temperature vs month, we can see two turning points. One where the graph changes from decreasing to increasing around $x = 6$ and $y\approx15$, and another where the graph changes from increasing to decreasing around $x = 11$ and $y\approx65$.
Answer:
$(6,15),(11,65)$