which graph represents the function $h(x) = 5.5|x|$?
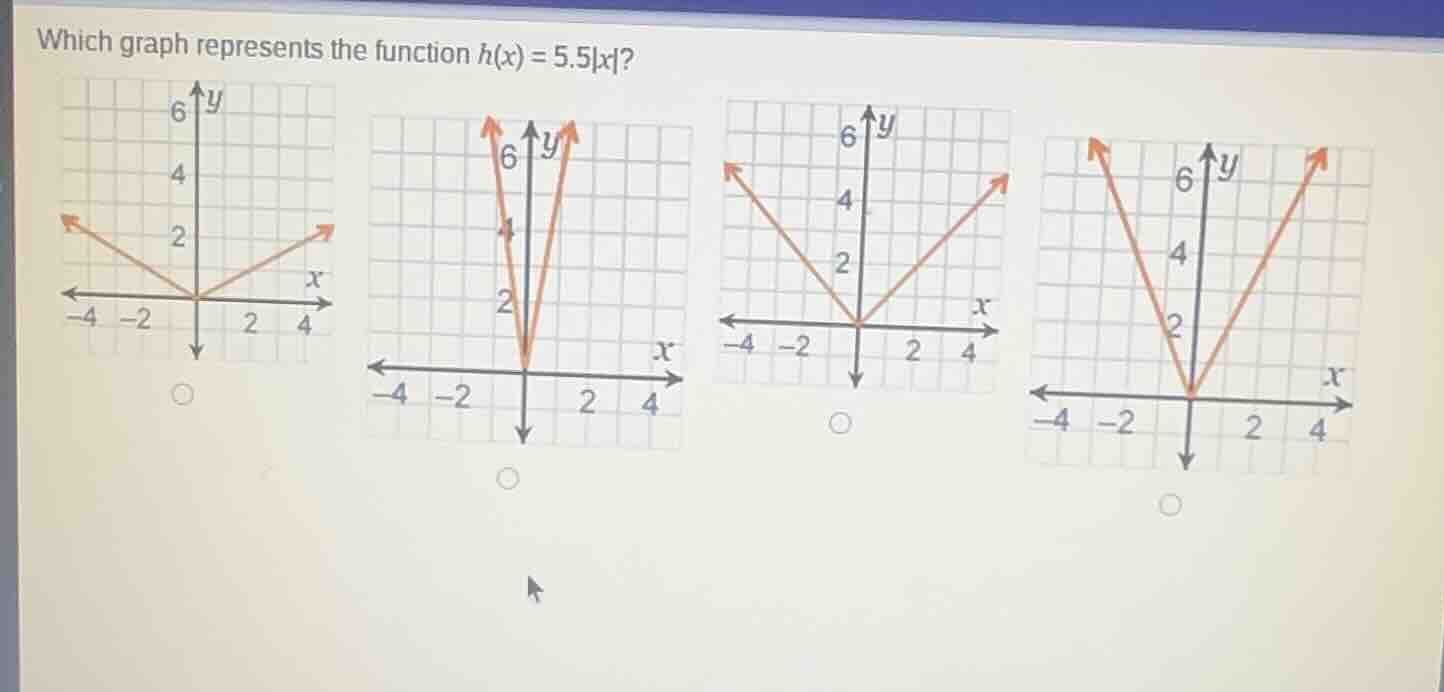
which graph represents the function $h(x) = 5.5|x|$?
Answer
Explanation:
Step1: Recall absolute value function form
The parent function is $f(x)=|x|$, which has a V-shape with slope $\pm1$ and vertex at $(0,0)$. For $h(x)=a|x|$, $a$ is the slope of the positive/negative branches.
Step2: Identify slope of given function
For $h(x)=5.5|x|$, the slope of the right branch ($x>0$) is $5.5=\frac{11}{2}$, and left branch ($x<0$) is $-5.5=-\frac{11}{2}$.
Step3: Test a point to verify
Take $x=1$: $h(1)=5.5(1)=5.5$. So the point $(1, 5.5)$ lies on the graph. This means at $x=1$, the $y$-value is 5.5, which is very close to 6, so the line rises steeply.
Step4: Match to the graph
Compare with options: the second graph has a steep V-shape where the line near $x=1$ reaches close to $y=6$, matching the slope of 5.5. The other graphs have smaller slopes (less steep lines).
Answer:
The second graph (top row, second from left, with the steep V-shape passing near (1, 5.5))