which graph below represents a function that is always decreasing over the entire interval -3 < x < 3?
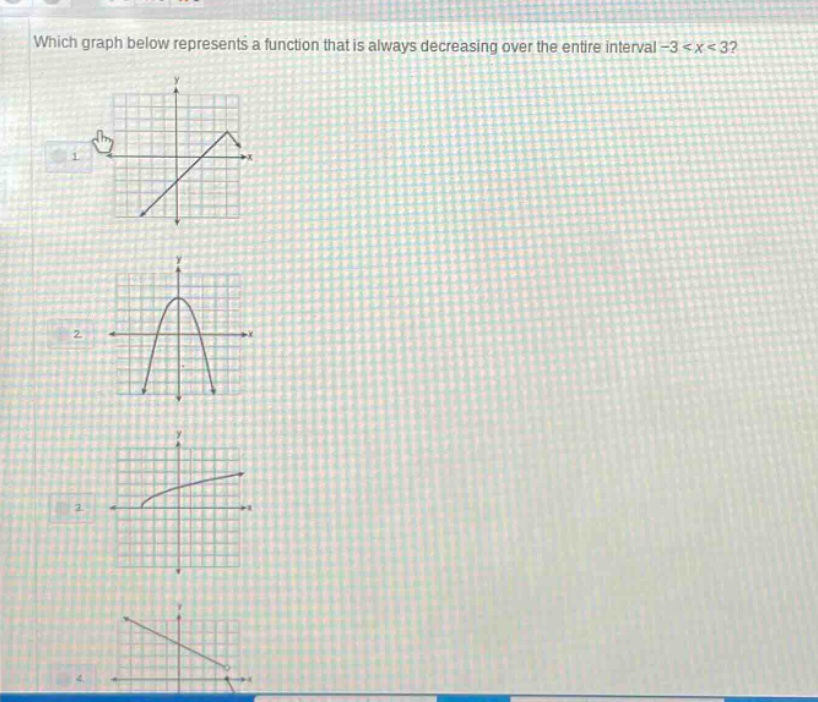
which graph below represents a function that is always decreasing over the entire interval -3 < x < 3?
Answer
Explanation:
Step1: Recall function - decreasing property
A function $y = f(x)$ is decreasing on an interval if for any two points $x_1$ and $x_2$ in the interval with $x_1<x_2$, we have $f(x_1)>f(x_2)$. Graphically, a decreasing - function has a negative slope on the given interval.
Step2: Analyze each graph
- In the first graph, the function is increasing on part of the interval $- 3<x<3$ and then decreasing.
- In the second graph, the function is increasing first and then decreasing, not always decreasing on $-3 < x < 3$.
- In the third graph, the function is increasing on the interval $-3 < x < 3$.
- In the fourth graph, as $x$ increases from values just greater than $-3$ to values just less than $3$, the $y$ - values of the function are getting smaller. The slope of the line representing the function is negative on the entire interval $-3 < x < 3$.
Answer:
The fourth graph.