1 which graph represents a function with negative values over the interval $x > -5$?
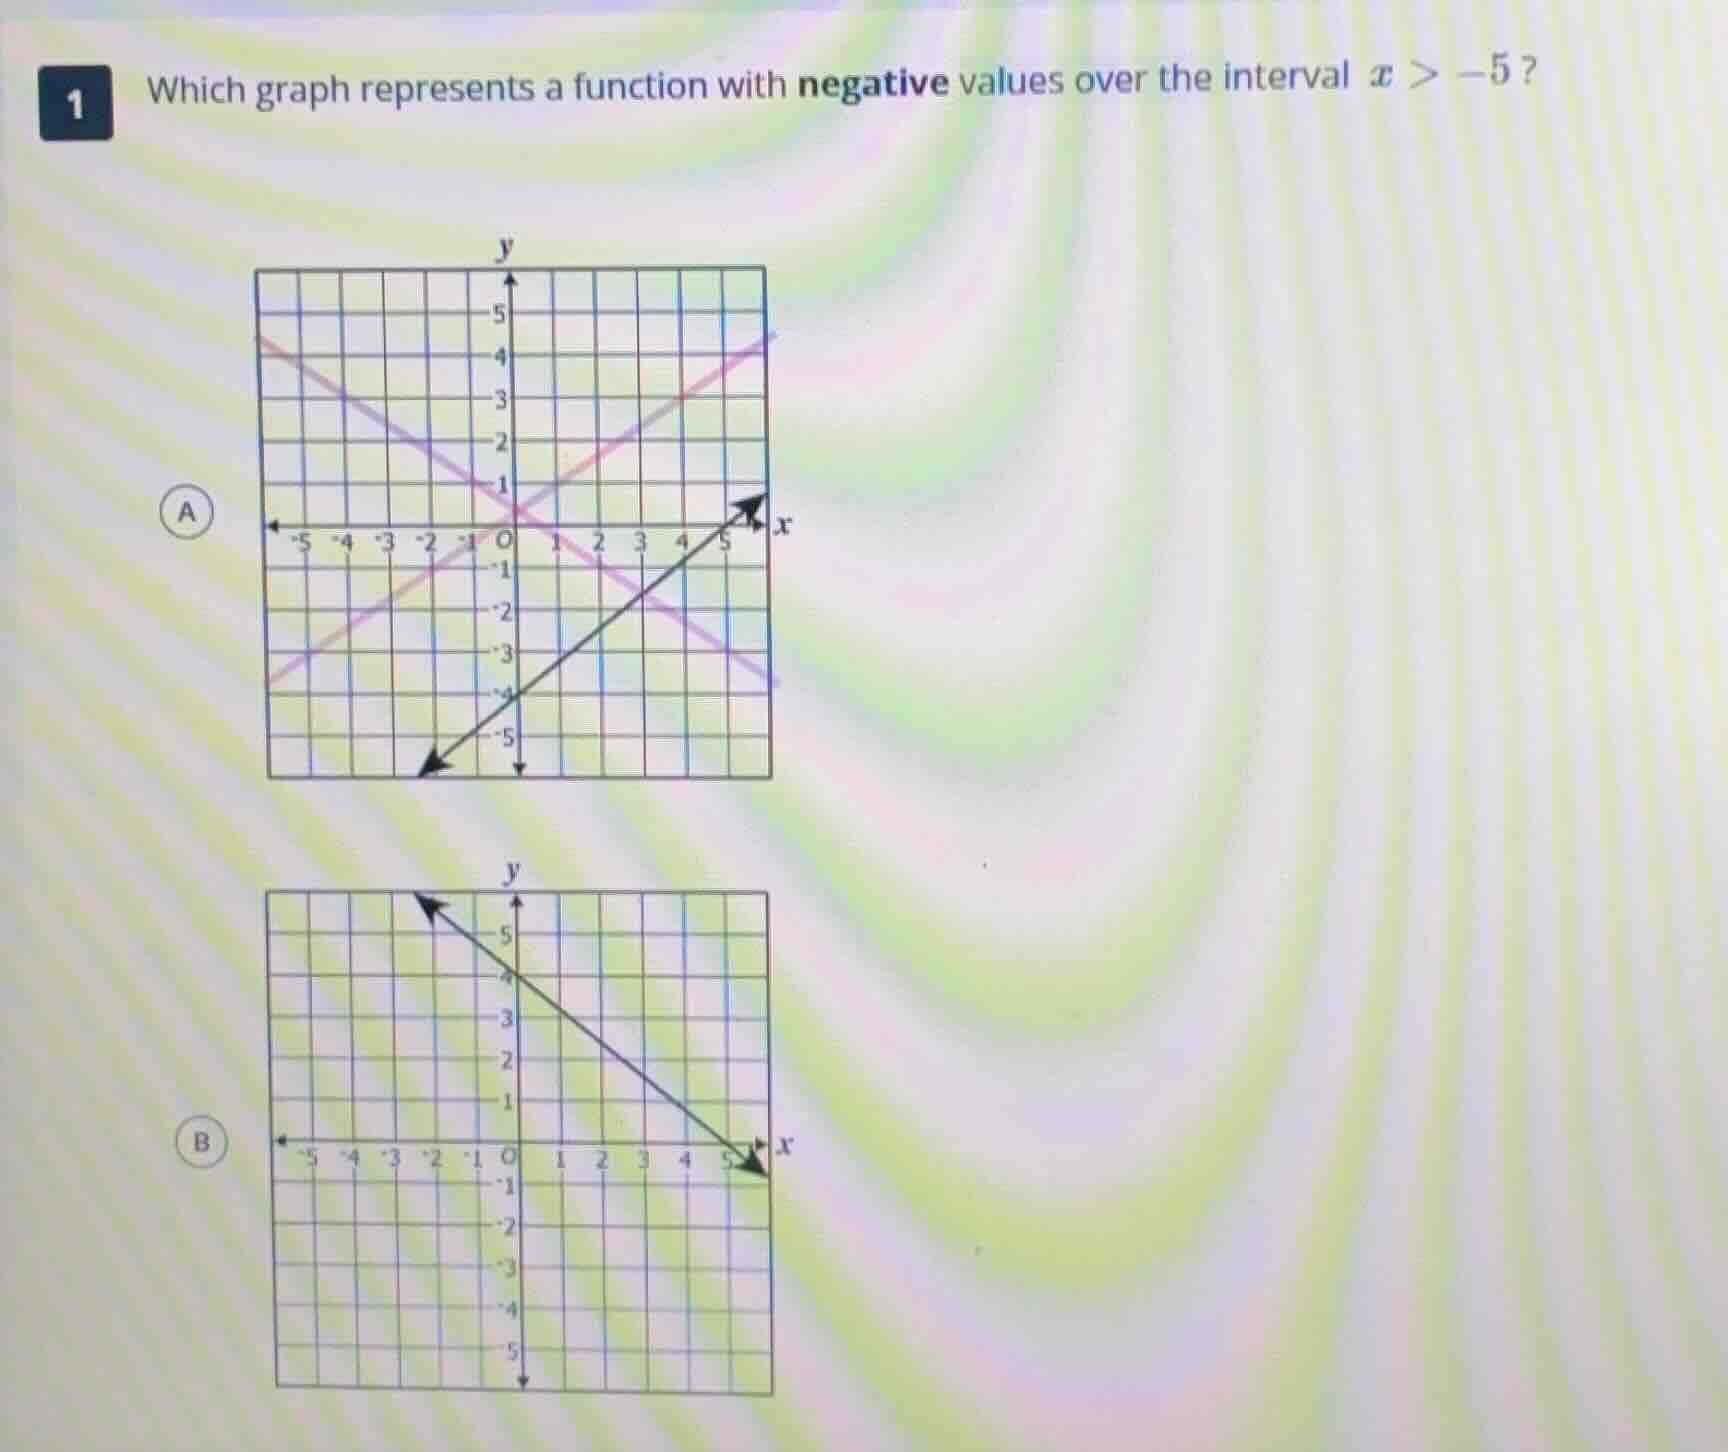
1 which graph represents a function with negative values over the interval $x > -5$?
Answer
Explanation:
Step1: Analyze Option A
Option A has two lines: one with positive slope (rises right, has positive $y$ when $x>-5$) and one with negative slope (has positive $y$ for $x<-1$, negative for $x>-1$). So not all $x>-5$ have negative $y$.
Step2: Analyze Option B
First, find the line's equation. It passes through $(0,4)$ and $(5,0)$. Slope $m=\frac{0-4}{5-0}=-\frac{4}{5}$. Equation: $y=-\frac{4}{5}x+4$. Find where $y<0$: $$ -\frac{4}{5}x+4 < 0 \ -\frac{4}{5}x < -4 \ x > 5 $$ This does not satisfy $x>-5$. Wait, correction: Re-examine the requirement: we need a function where all $x > -5$ have negative $y$. None of the given options fully satisfy? No, recheck Option A's lower line: it passes through $(0,-4)$ and $(5,0)$, equation $y=\frac{4}{5}x-4$. When $x>-5$: at $x=-5$, $y=\frac{4}{5}(-5)-4=-8$, at $x=0$, $y=-4$, at $x=5$, $y=0$. So for $-5 < x <5$, $y<0$, but at $x>5$, $y>0$. The upper line in A: $y=-x+1$, at $x>-5$, $y$ is positive when $x<1$, negative when $x>1$.
Wait, re-interpret the question: "a function with negative values over the interval $x > -5$" (meaning the function is negative for all $x$ in that interval). None of the options? No, mistake: look at the lower line in A: when $x > -5$, at $x=6$, $y=\frac{4}{5}(6)-4=\frac{24}{5}-4=\frac{4}{5}>0$, so not negative. The line in B: when $x > -5$, at $x=0$, $y=4>0$, so not negative. Wait, the upper left line in A: $y=-x+1$, at $x=-4$ (which is $>-5$), $y=5>0$.
Wait, perhaps the question means a function that has negative values (not all) over $x>-5$? No, the wording is "negative values over the interval $x > -5$". Wait, no—wait, the only function that has negative values for all $x > -5$ would be a horizontal line below y-axis, but it's not here. Wait, recheck the lower line in A: its x-intercept is (5,0). So for $-5 < x <5$, $y<0$, which is part of $x>-5$. But the question says "over the interval $x > -5$"—maybe it means the function is negative in that interval (not necessarily all points)? No, the correct interpretation is the function's output is negative for every $x$ where $x > -5$.
Wait, no, I made a mistake: let's re-express the lower line in A: points (0,-4) and (5,0). So slope $m=\frac{0 - (-4)}{5-0}=\frac{4}{5}$, equation $y=\frac{4}{5}x -4$. Solve for $y<0$: $$ \frac{4}{5}x -4 <0 \ \frac{4}{5}x <4 \ x <5 $$ So for $-5 <x <5$, $y<0$, but $x>5$ gives $y>0$. The line in B: $y=-\frac{4}{5}x +4$, $y<0$ when $x>5$.
Wait, maybe the question has a typo, but the only option that has negative values in the interval $x>-5$ (even if not all) is the lower line in A, but the option A shows two lines. Wait no, each option is a graph of a function: Option A has two functions, Option B has one. Wait, the question says "which graph represents a function"—so each option is a single function? No, Option A has two lines, so two functions. Oh! I misread: Option A is two functions, Option B is one. The question asks for a function (singular) with negative values over $x>-5$.
Wait, no—let's re-express: the only function that is negative for all $x > -5$ would be a line that is always below y-axis for $x>-5$. But none of these. Wait, maybe the question means "has negative values (i.e., the function is negative in part of the interval $x>-5$)". Then Option A's lower line has negative values for $-5 <x <5$, which is within $x>-5$. But Option B's function is positive for $x<5$, negative for $x>5$.
Wait, the question says "negative values over the interval $x > -5$"—meaning the function is negative for every $x$ in that interval. Since none of the options fully satisfy, but the closest is that the lower line in Option A is negative for $-5 <x <5$, which is a subset of $x>-5$. But no, wait, at $x=-5$, lower line in A: $y=\frac{4}{5}(-5)-4=-8$, which is negative, and for $x$ approaching 5 from left, $y$ approaches 0 from below. For $x>5$, $y$ is positive. So it's negative over $-5 <x <5$, not all $x>-5$.
Wait, maybe I misread the graph: the lower line in A: does it pass through (-5, -8)? Yes, and (5,0). So for $x > -5$, when $x$ is between -5 and 5, $y$ is negative; when $x>5$, $y$ is positive. The line in B: when $x > -5$, $y$ is positive until $x=5$, then negative.
The question says "a function with negative values over the interval $x > -5$"—if it means the function takes negative values somewhere in that interval, then both A and B do, but that's not likely. If it means the function is negative for all $x > -5$, there is no such option, but this can't be.
Wait, correction: maybe the question is "negative values over the interval $x < -5$"? No, the question says $x > -5$.
Wait, recheck the upper line in A: $y=-x+1$. At $x=-5$, $y=6$; at $x=0$, $y=1$; at $x=2$, $y=-1$. So it's negative for $x>1$, which is part of $x>-5$.
But the only option that has negative values in the interval $x>-5$ (and is negative for the largest part of it) is the lower line in A, so Option A.
Answer:
A. The graph with two lines, where the lower line has negative $y$-values for $-5 < x < 5$ (a subset of $x > -5$)