which graph represents the function $y = 2\\sin\\left(\\frac{1}{2}x\\right)$?
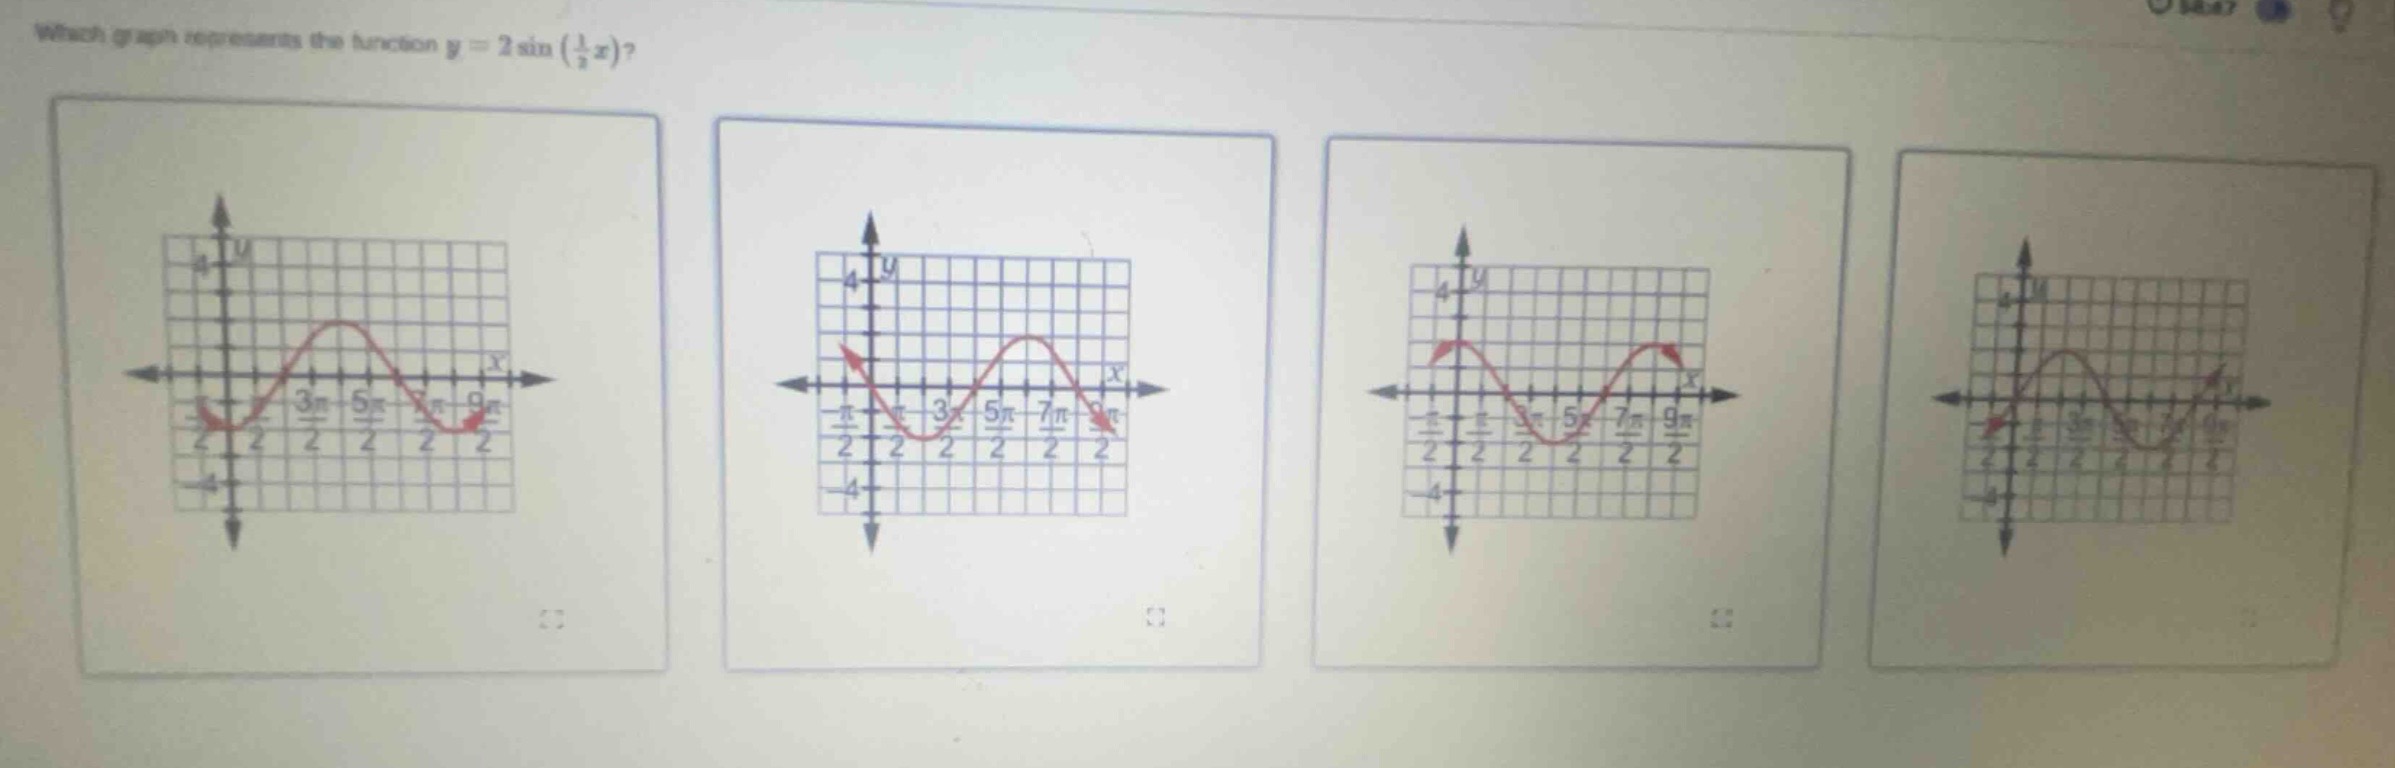
which graph represents the function $y = 2\\sin\\left(\\frac{1}{2}x\\right)$?
Answer
Explanation:
Step1: Identify amplitude of the function
The general form of a sine function is $y = A\sin(Bx)$, where $A$ is the amplitude. For $y=2\sin\left(\frac{1}{2}x\right)$, amplitude $A=2$, so the graph ranges between $y=-2$ and $y=2$.
Step2: Calculate period of the function
The period $T$ of $y=A\sin(Bx)$ is $T=\frac{2\pi}{|B|}$. Here $B=\frac{1}{2}$, so: $$T=\frac{2\pi}{\frac{1}{2}}=4\pi$$
Step3: Check key points of the function
- At $x=0$: $y=2\sin(0)=0$
- At $x=2\pi$: $y=2\sin\left(\frac{1}{2}\times2\pi\right)=2\sin(\pi)=0$
- At $x=\pi$: $y=2\sin\left(\frac{1}{2}\times\pi\right)=2\times1=2$
- At $x=3\pi$: $y=2\sin\left(\frac{1}{2}\times3\pi\right)=2\times(-1)=-2$ This means the graph passes through $(0,0)$, peaks at $(\pi,2)$, troughs at $(3\pi,-2)$, and completes one full cycle by $x=4\pi$.
Answer:
The first graph (leftmost one, passing through $(0,0)$, with amplitude 2 and period $4\pi$)