which graph represents a phase shift of $\frac{pi}{2}$ units right for the graph of $y = cos x$?\na. $y=sin…
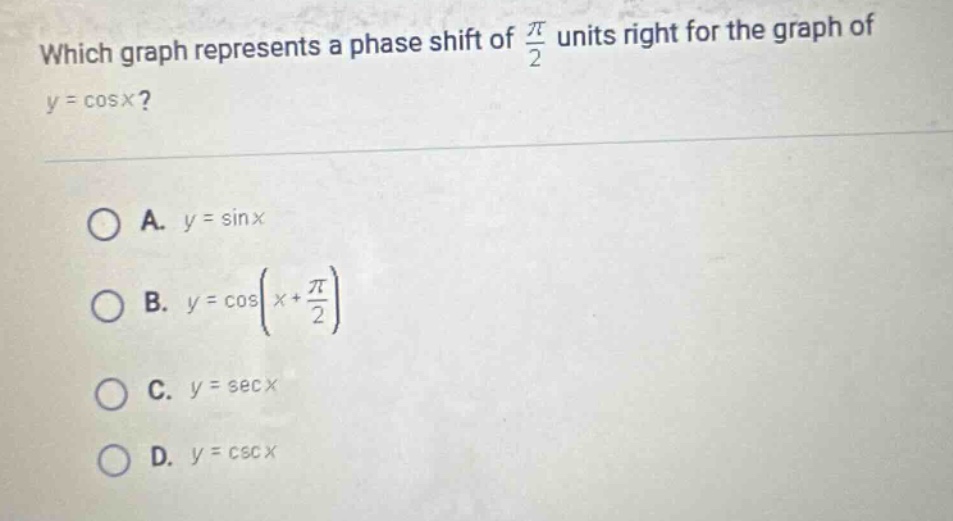
which graph represents a phase shift of $\frac{pi}{2}$ units right for the graph of $y = cos x$?\na. $y=sin x$\nb. $y = cos(x+\frac{pi}{2})$\nc. $y=sec x$\nd. $y=csc x$
Answer
Explanation:
Step1: Recall phase - shift formula
The general form of a horizontal (phase) shift of a function $y = f(x)$ is $y=f(x - h)$, where $h>0$ is a shift to the right and $h < 0$ is a shift to the left. For the function $y=\cos x$, a phase - shift of $\frac{\pi}{2}$ units to the right gives $y = \cos(x-\frac{\pi}{2})$.
Step2: Use trigonometric identity
We know the co - function identity $\cos(A - B)=\cos A\cos B+\sin A\sin B$. When $A = x$ and $B=\frac{\pi}{2}$, we have $\cos(x-\frac{\pi}{2})=\cos x\cos\frac{\pi}{2}+\sin x\sin\frac{\pi}{2}$. Since $\cos\frac{\pi}{2}=0$ and $\sin\frac{\pi}{2}=1$, then $\cos(x - \frac{\pi}{2})=\sin x$.
Answer:
A. $y=\sin x$