the graph to the right shows the heart rate of a person watching a short romantic film, where x represents…
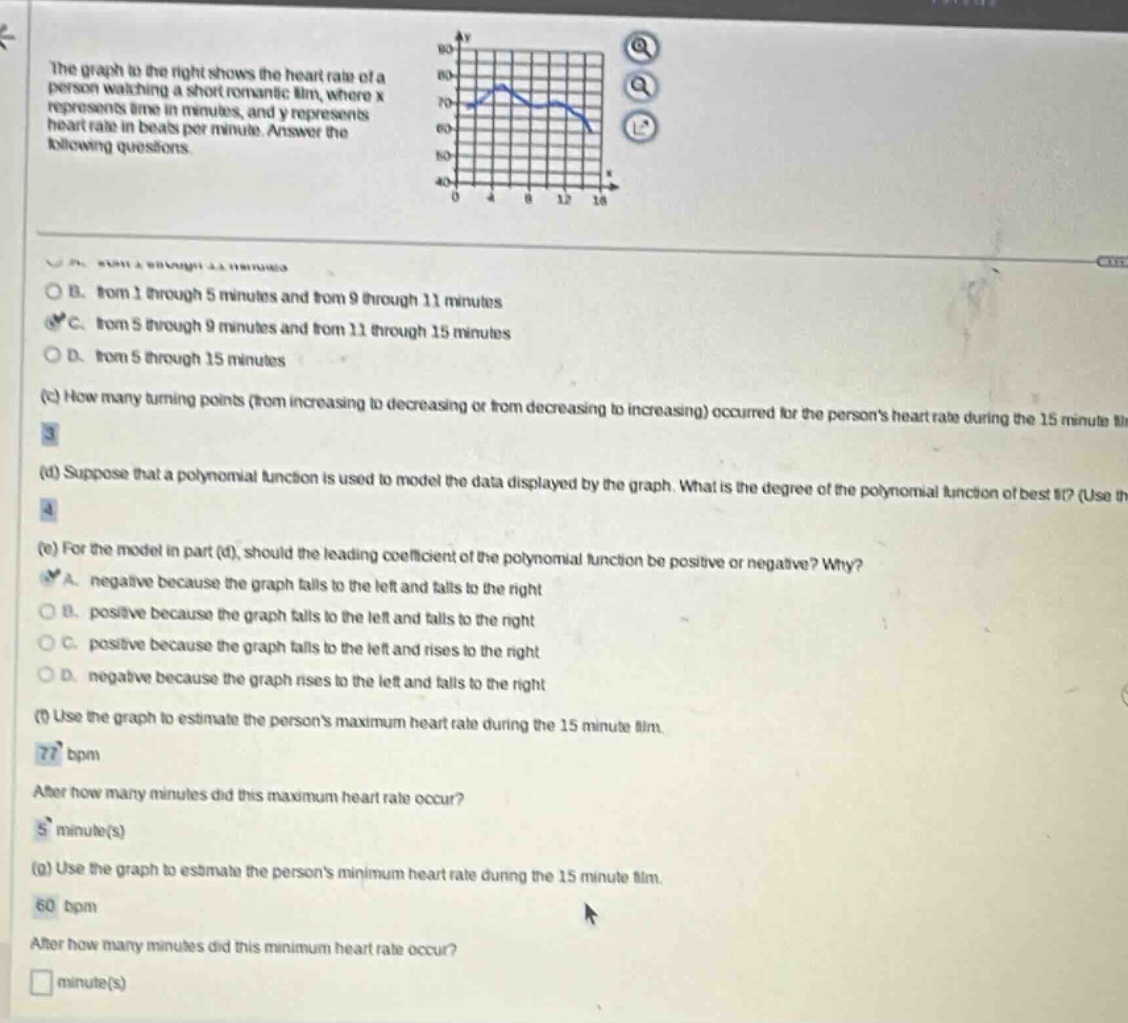
the graph to the right shows the heart rate of a person watching a short romantic film, where x represents time in minutes, and y represents heart rate in beats per minute. answer the following questions.\n\n(c) how many turning points (from increasing to decreasing or from decreasing to increasing) occurred for the persons heart rate during the 15 - minute film?\n3\n(d) suppose that a polynomial function is used to model the data displayed by the graph. what is the degree of the polynomial function of best fit? (use the)\n4\n(e) for the model in part (d), should the leading coefficient of the polynomial function be positive or negative? why?\na. negative because the graph falls to the left and falls to the right\nb. positive because the graph falls to the left and falls to the right\nc. positive because the graph falls to the left and rises to the right\nd. negative because the graph rises to the left and falls to the right\n(f) use the graph to estimate the persons maximum heart rate during the 15 - minute film.\n77 bpm\nafter how many minutes did this maximum heart rate occur?\n5 minute(s)\n(g) use the graph to estimate the persons minimum heart rate during the 15 - minute film.\n60 bpm\nafter how many minutes did this minimum heart rate occur?\n minute(s)
Answer
Answer:
- C
- 3
- 4
- A
- 77 bpm, 5
- 60 bpm, 15
Explanation:
Step1: Analyze heart - rate decrease intervals
The heart - rate is decreasing when the graph is going down. By observing the graph, it is decreasing from 5 through 9 minutes and from 11 through 15 minutes.
Step2: Count turning points
Turning points are where the graph changes from increasing to decreasing or vice - versa. Counting these on the graph gives 3 turning points.
Step3: Determine polynomial degree
The number of turning points of a polynomial function is at most one less than the degree of the polynomial. With 3 turning points, the best - fit polynomial degree is 4.
Step4: Determine leading coefficient sign
For a polynomial, if the graph falls to the left and falls to the right, the leading coefficient is negative.
Step5: Find maximum heart rate and time
The highest point on the graph has a y - value of 77 (heart rate in bpm) and an x - value of 5 (time in minutes).
Step6: Find minimum heart rate and time
The lowest point on the graph has a y - value of 60 (heart rate in bpm) and an x - value of 15 (time in minutes).