(a) the graph of y = f(x) is shown. draw the graph of y=-f(x). (b)
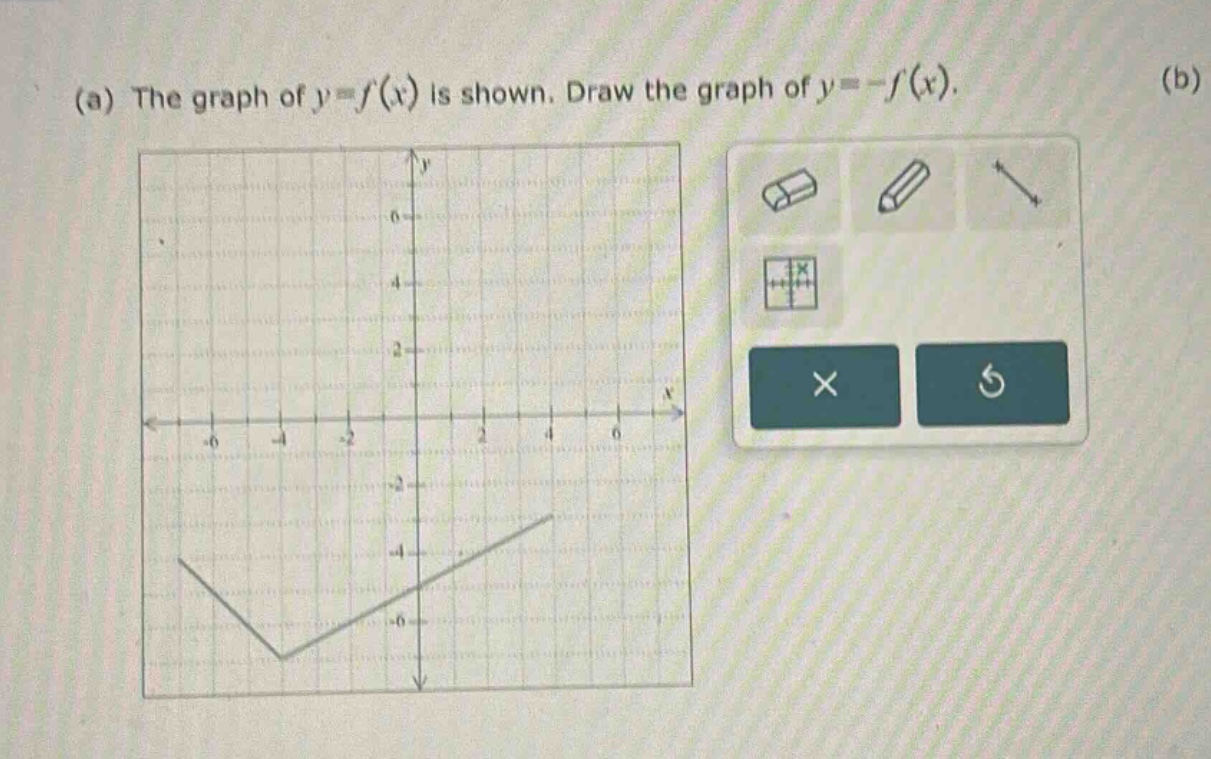
(a) the graph of y = f(x) is shown. draw the graph of y=-f(x). (b)
Answer
Explanation:
Step1: Recall transformation rule
The graph of $y = - f(x)$ is the reflection of the graph of $y=f(x)$ about the $x -$axis. For any point $(x,y)$ on the graph of $y = f(x)$, the corresponding point on the graph of $y=-f(x)$ is $(x, - y)$.
Step2: Identify key points on $y = f(x)$
Let's assume some key - points on the given graph of $y = f(x)$. For example, if there is a point $(x_1,y_1)$ on $y = f(x)$, we find its new $y$ - coordinate for the graph of $y=-f(x)$.
Step3: Plot new points
Plot the points $(x,-y)$ for all the key - points $(x,y)$ of $y = f(x)$ and then connect these new points with a smooth curve to get the graph of $y=-f(x)$.
Answer:
To draw the graph of $y = - f(x)$, reflect each point on the graph of $y = f(x)$ about the $x$-axis.