(b) the graph of $y=g(x)$ is shown. draw the graph of $y=-g(x)$.
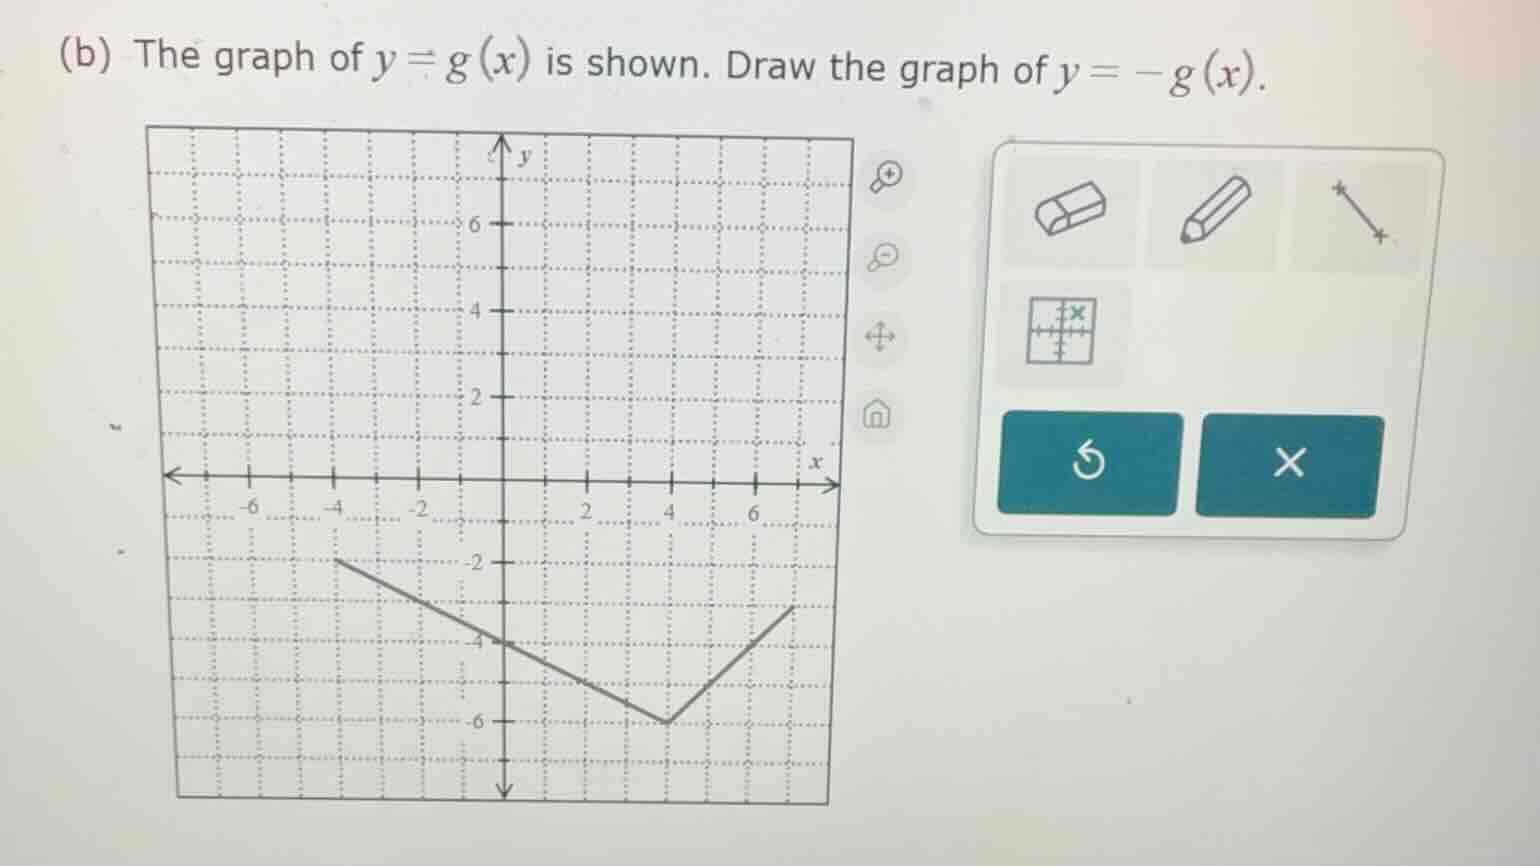
(b) the graph of $y=g(x)$ is shown. draw the graph of $y=-g(x)$.
Answer
Explanation:
Step1: Identify key points of $g(x)$
Key points on $y=g(x)$: $(-4, -2)$, $(0, -4)$, $(5, -6)$, $(7, -4)$
Step2: Reflect points over x-axis
For $y=-g(x)$, flip y-values: $(-4, 2)$, $(0, 4)$, $(5, 6)$, $(7, 4)$
Step3: Plot and connect new points
Draw line segments between the reflected points.
Answer:
The graph of $y=-g(x)$ is the reflection of $y=g(x)$ across the x-axis, passing through the points $(-4, 2)$, $(0, 4)$, $(5, 6)$, and $(7, 4)$, connected in order to match the shape of the original graph mirrored over the x-axis.