the graph shown in the figure represents a certain sine function. its equation is: \no y = -3 sin(π/4 x +…
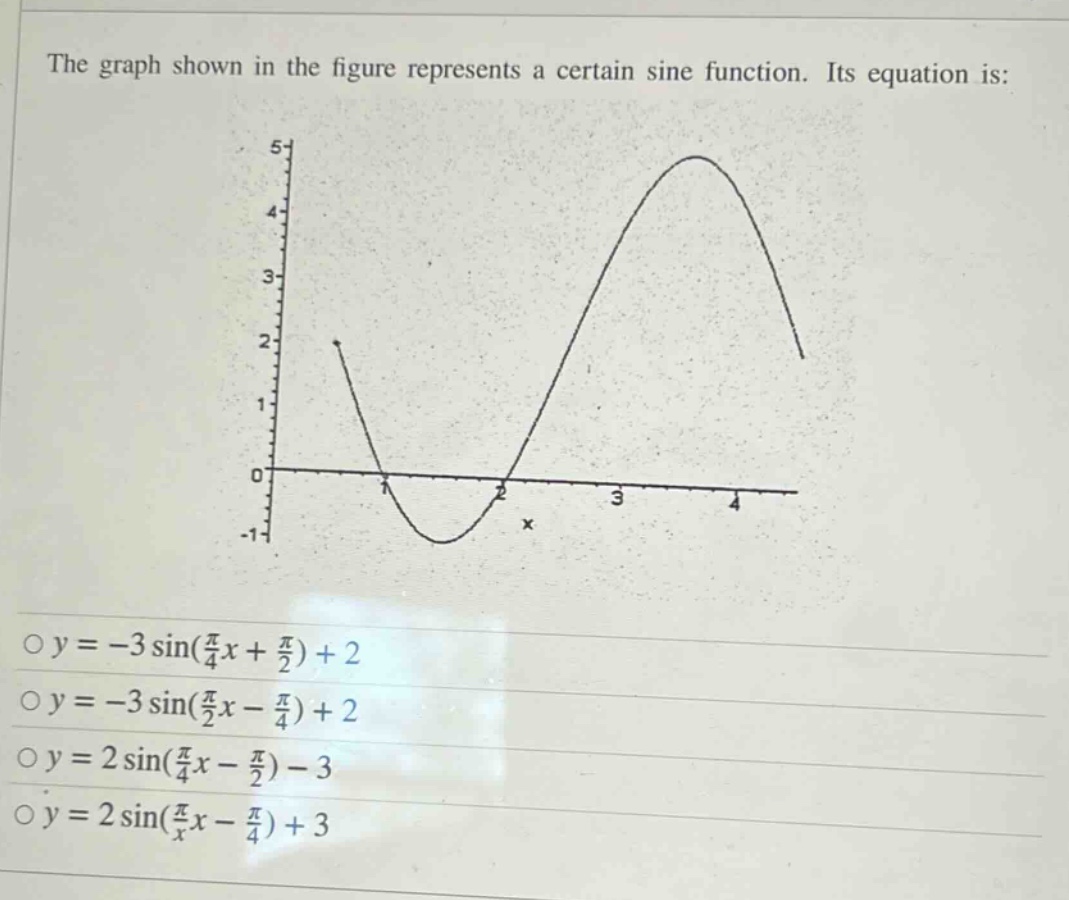
the graph shown in the figure represents a certain sine function. its equation is: \no y = -3 sin(π/4 x + π/2) + 2\no y = -3 sin(π/2 x - π/4) + 2\no y = 2 sin(π/4 x - π/2) - 3\no y = 2 sin(π/x x - π/4) + 3
Answer
Answer:
A. $y = - 3\sin(\frac{\pi}{4}x+\frac{\pi}{2})+2$
Explanation:
Step1: Determine the amplitude
The amplitude $A$ is the absolute - value of the coefficient of the sine function. The range of the function in the graph is from $y = - 1$ to $y = 5$, so the amplitude $A=\frac{5 - (-1)}{2}=3$. The graph is reflected vertically (opens down - ward), so $A=-3$.
Step2: Determine the vertical shift
The mid - line of the sine function is $y=\frac{5+( - 1)}{2}=2$, so the vertical shift $D = 2$.
Step3: Determine the period
The period $T$ of a sine function $y = A\sin(Bx - C)+D$ is given by $T=\frac{2\pi}{B}$. From the graph, the period is $T = 8$. So, $\frac{2\pi}{B}=8$, then $B=\frac{\pi}{4}$.
Step4: Determine the phase shift
We can use a point on the graph. Let's consider the starting point of the cycle. When $x = 0$, we can substitute into the general form $y=-3\sin(\frac{\pi}{4}x + C)+2$. By checking the position of the graph at $x = 0$, we find that when we substitute into $y=-3\sin(\frac{\pi}{4}x+\frac{\pi}{2})+2$, it matches the initial value of the graph. So the phase shift $C=\frac{\pi}{2}$. So the equation of the sine function is $y=-3\sin(\frac{\pi}{4}x+\frac{\pi}{2})+2$.