the graph of y = f(x) is shown below.\nwhat is the graph of y = f(x + 1)-2?
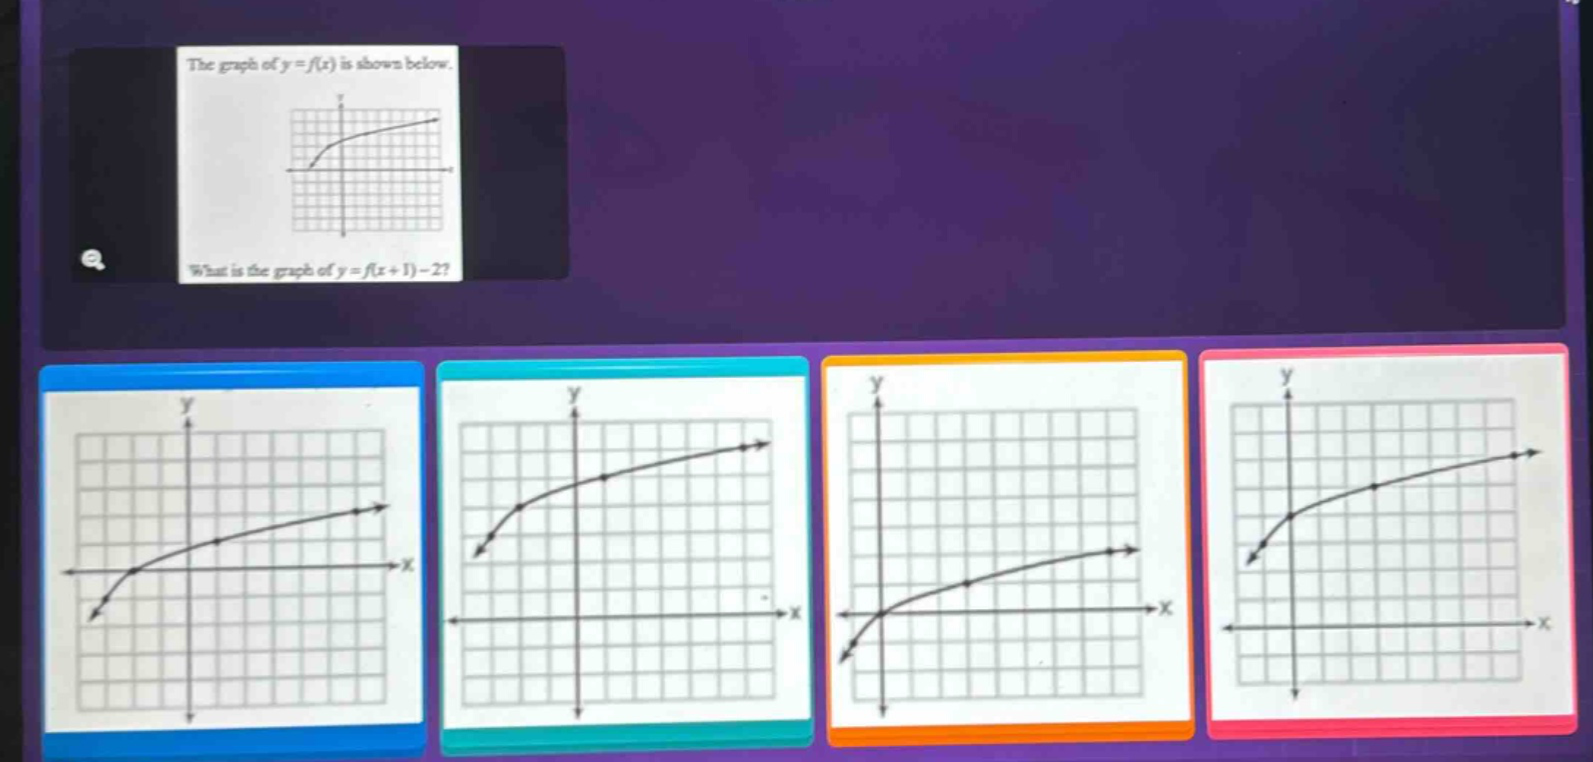
the graph of y = f(x) is shown below.\nwhat is the graph of y = f(x + 1)-2?
Answer
Explanation:
Step1: Analyze horizontal shift
For the function $y = f(x + 1)$, the graph of $y=f(x)$ is shifted 1 unit to the left. This is because when we replace $x$ with $x + 1$ in the function, for the same $y$-value, the $x$-coordinate is 1 unit less than in $y = f(x)$.
Step2: Analyze vertical shift
For the function $y=f(x + 1)-2$, after the horizontal - shift, the graph of $y = f(x + 1)$ is shifted 2 units down. This is because we subtract 2 from the $y$-values of $y = f(x + 1)$.
Answer:
The graph of $y = f(x)$ is shifted 1 unit to the left and 2 units down.