the graph of f(x) is shown. over which interval on the x - axis is there a negative rate of change in the…
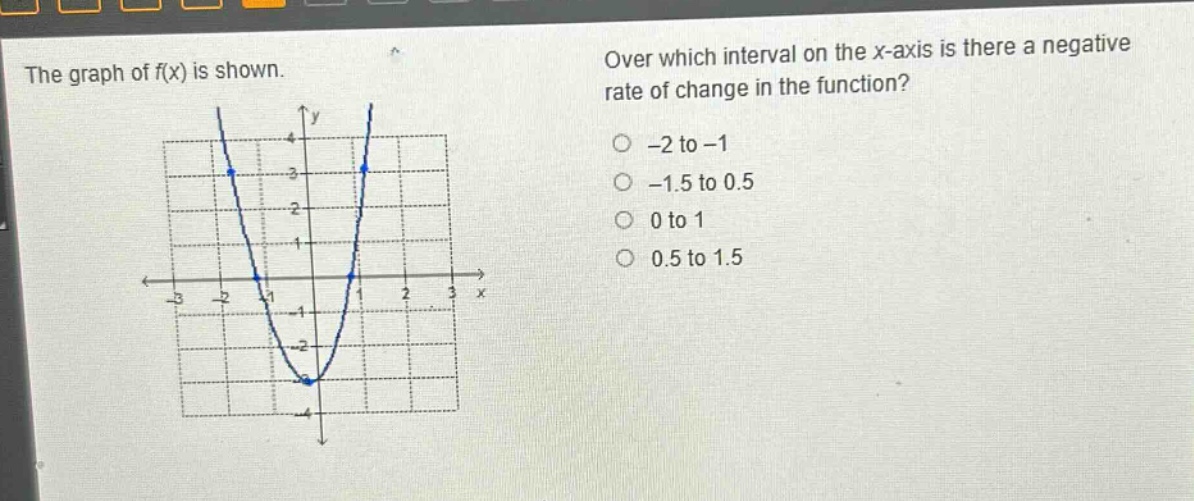
the graph of f(x) is shown. over which interval on the x - axis is there a negative rate of change in the function? -2 to -1 -1.5 to 0.5 0 to 1 0.5 to 1.5
Answer
Explanation:
Step1: Recall rate - of - change concept
The rate of change of a function $y = f(x)$ over an interval $[a,b]$ is $\frac{f(b)-f(a)}{b - a}$. A negative rate of change means $f(b)-f(a)<0$ when $b > a$, i.e., the function is decreasing.
Step2: Analyze the graph
Examine the function's graph. A function is decreasing when the $y$ - values are getting smaller as the $x$ - values increase. Looking at the graph of $y = f(x)$, the function is decreasing over the interval from $x=-1.5$ to $x = 0.5$.
Answer:
-1.5 to 0.5