4. the graph of y = f(x) is shown. order the following from least to greatest. a. average rate of change of…
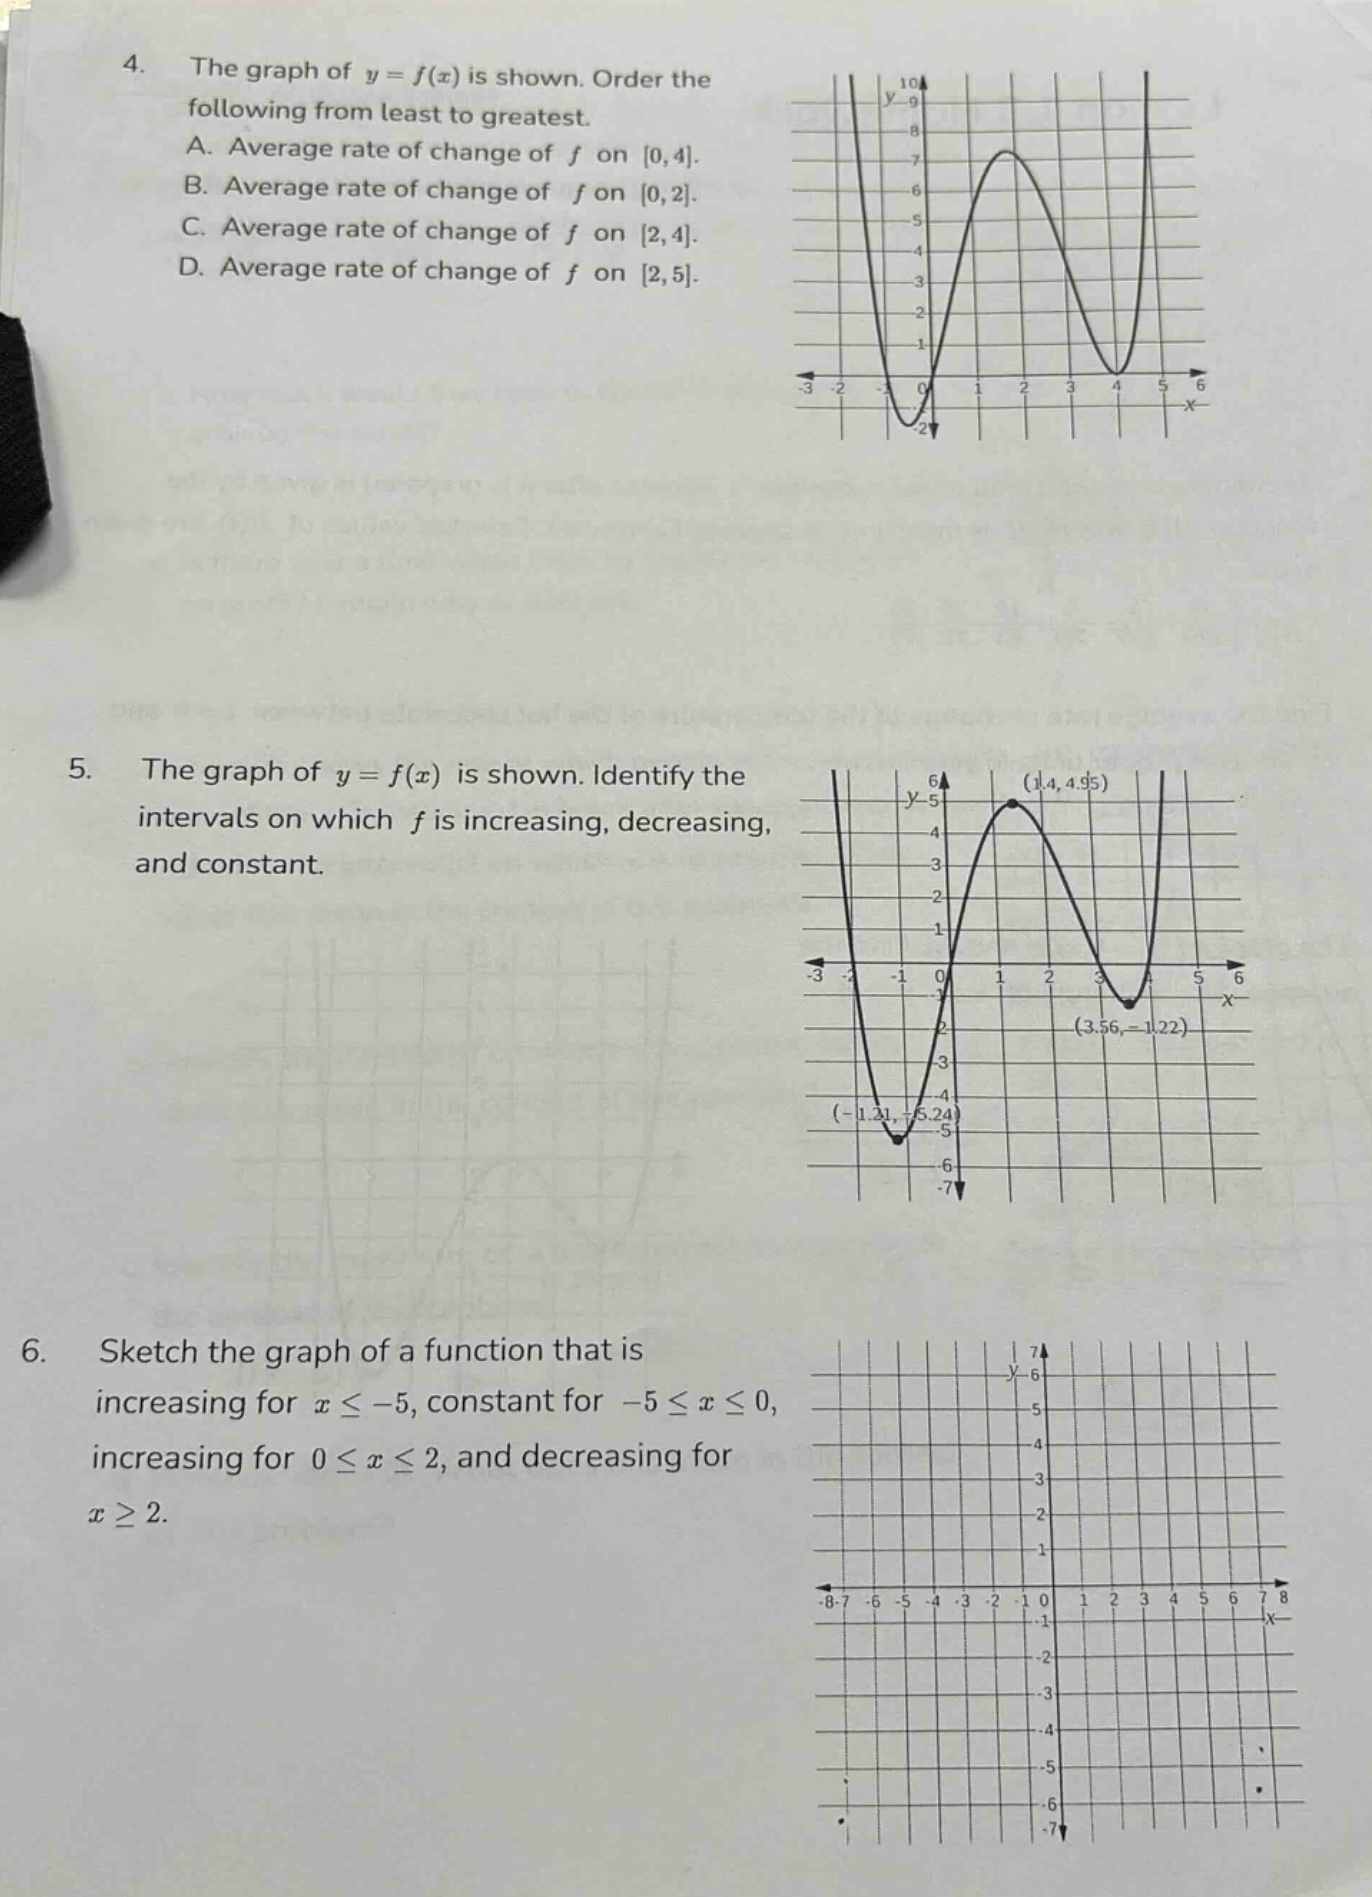
4. the graph of y = f(x) is shown. order the following from least to greatest. a. average rate of change of f on 0,4. b. average rate of change of f on 0,2. c. average rate of change of f on 2,4. d. average rate of change of f on 2,5. 5. the graph of y = f(x) is shown. identify the intervals on which f is increasing, decreasing, and constant. 6. sketch the graph of a function that is increasing for x ≤ -5, constant for -5 ≤ x ≤ 0, increasing for 0 ≤ x ≤ 2, and decreasing for x ≥ 2.
Answer
4.
Explanation:
Step1: Recall average - rate - of - change formula
The average rate of change of a function $y = f(x)$ on the interval $[a,b]$ is $\frac{f(b)-f(a)}{b - a}$, which is the slope of the secant line through the points $(a,f(a))$ and $(b,f(b))$.
Step2: Analyze the secant - line slopes for each interval
- For the interval $[0,4]$: The secant line through $(0,f(0))$ and $(4,f(4))$ has a positive slope.
- For the interval $[0,2]$: The secant line through $(0,f(0))$ and $(2,f(2))$ has a steeper positive slope than the secant line on $[0,4]$.
- For the interval $[2,4]$: The secant line through $(2,f(2))$ and $(4,f(4))$ has a negative slope.
- For the interval $[2,5]$: The secant line through $(2,f(2))$ and $(5,f(5))$ has a negative slope, and its magnitude is less than the magnitude of the slope of the secant line on $[2,4]$.
Step3: Order the average rates of change
Since the average rate of change on $[2,4]$ is the most negative, followed by the average rate of change on $[2,5]$, then the average rate of change on $[0,4]$, and the average rate of change on $[0,2]$ is the largest. The order from least to greatest is C, D, A, B.
Answer:
C, D, A, B
5.
Explanation:
Step1: Recall the definitions of increasing, decreasing, and constant functions
A function $y = f(x)$ is increasing on an interval if for any two points $x_1<x_2$ in the interval, $f(x_1)<f(x_2)$; decreasing if $f(x_1)>f(x_2)$; and constant if $f(x_1)=f(x_2)$.
Step2: Analyze the graph
- Increasing intervals: By observing the graph, the function is increasing on the intervals $(-1.21,1.4)$ and $(3.56,5)$.
- Decreasing intervals: The function is decreasing on the intervals $(-3,-1.21)$ and $(1.4,3.56)$.
- Constant intervals: There are no constant - value intervals for this function.
Answer:
Increasing: $(-1.21,1.4),(3.56,5)$; Decreasing: $(-3,-1.21),(1.4,3.56)$; Constant: None
6.
Explanation:
Step1: Sketch the increasing part for $x\leq - 5$
Start at an arbitrary point on the left - hand side of the $x$ - axis. Draw a line with a positive slope (going up as you move to the left) until $x=-5$.
Step2: Sketch the constant part for $-5\leq x\leq0$
Draw a horizontal line from $x = - 5$ to $x = 0$.
Step3: Sketch the increasing part for $0\leq x\leq2$
Draw a line with a positive slope (going up as you move to the right) from $x = 0$ to $x = 2$.
Step4: Sketch the decreasing part for $x\geq2$
Draw a line with a negative slope (going down as you move to the right) starting at $x = 2$ and extending to the right.
Answer:
The graph is sketched as described above with an increasing part for $x\leq - 5$, a constant part for $-5\leq x\leq0$, an increasing part for $0\leq x\leq2$, and a decreasing part for $x\geq2$.