the graph of y = f(x) is shown to the right. identify the intervals on which f(x) is decreasing. which of…
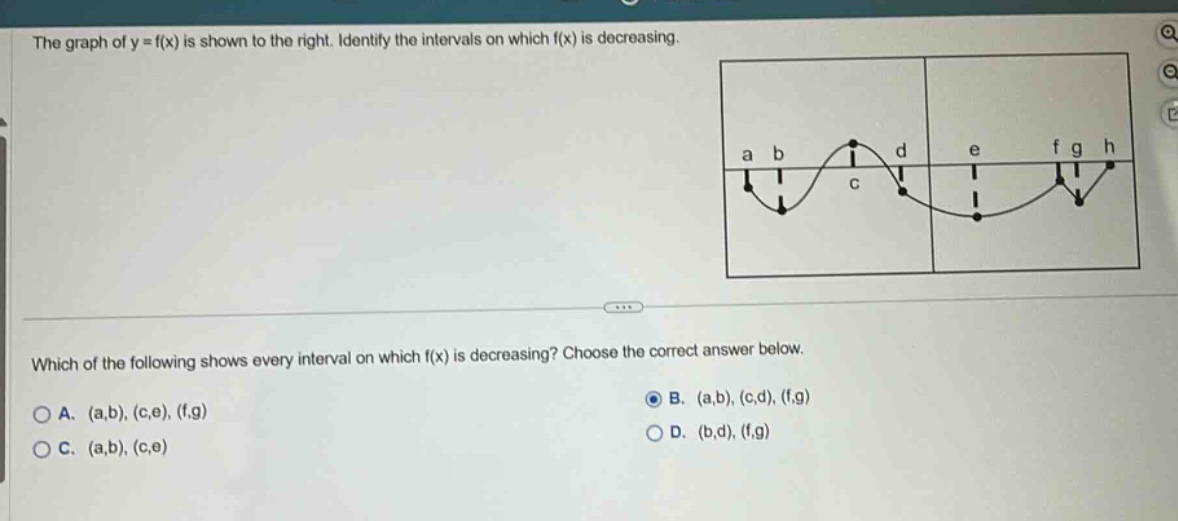
the graph of y = f(x) is shown to the right. identify the intervals on which f(x) is decreasing. which of the following shows every interval on which f(x) is decreasing? choose the correct answer below. a. (a,b), (c,e), (f,g) b. (a,b), (c,d), (f,g) c. (a,b), (c,e) d. (b,d), (f,g)
Answer
Explanation:
Step1: Recall decreasing - function definition
A function $y = f(x)$ is decreasing on an interval if for any two points $x_1$ and $x_2$ in the interval with $x_1<x_2$, we have $f(x_1)>f(x_2)$. On a graph, this means the graph is going down - hill from left to right.
Step2: Analyze the graph
Looking at the graph of $y = f(x)$:
- In the interval $(a,b)$, as $x$ increases from $a$ to $b$, the $y$ - values of the function are decreasing.
- In the interval $(c,d)$, as $x$ increases from $c$ to $d$, the $y$ - values of the function are decreasing.
- In the interval $(f,g)$, as $x$ increases from $f$ to $g$, the $y$ - values of the function are decreasing.
Answer:
B. $(a,b),(c,d),(f,g)$