the graph below shows the derivative f (x) of the function f (x). at which of the following x values does…
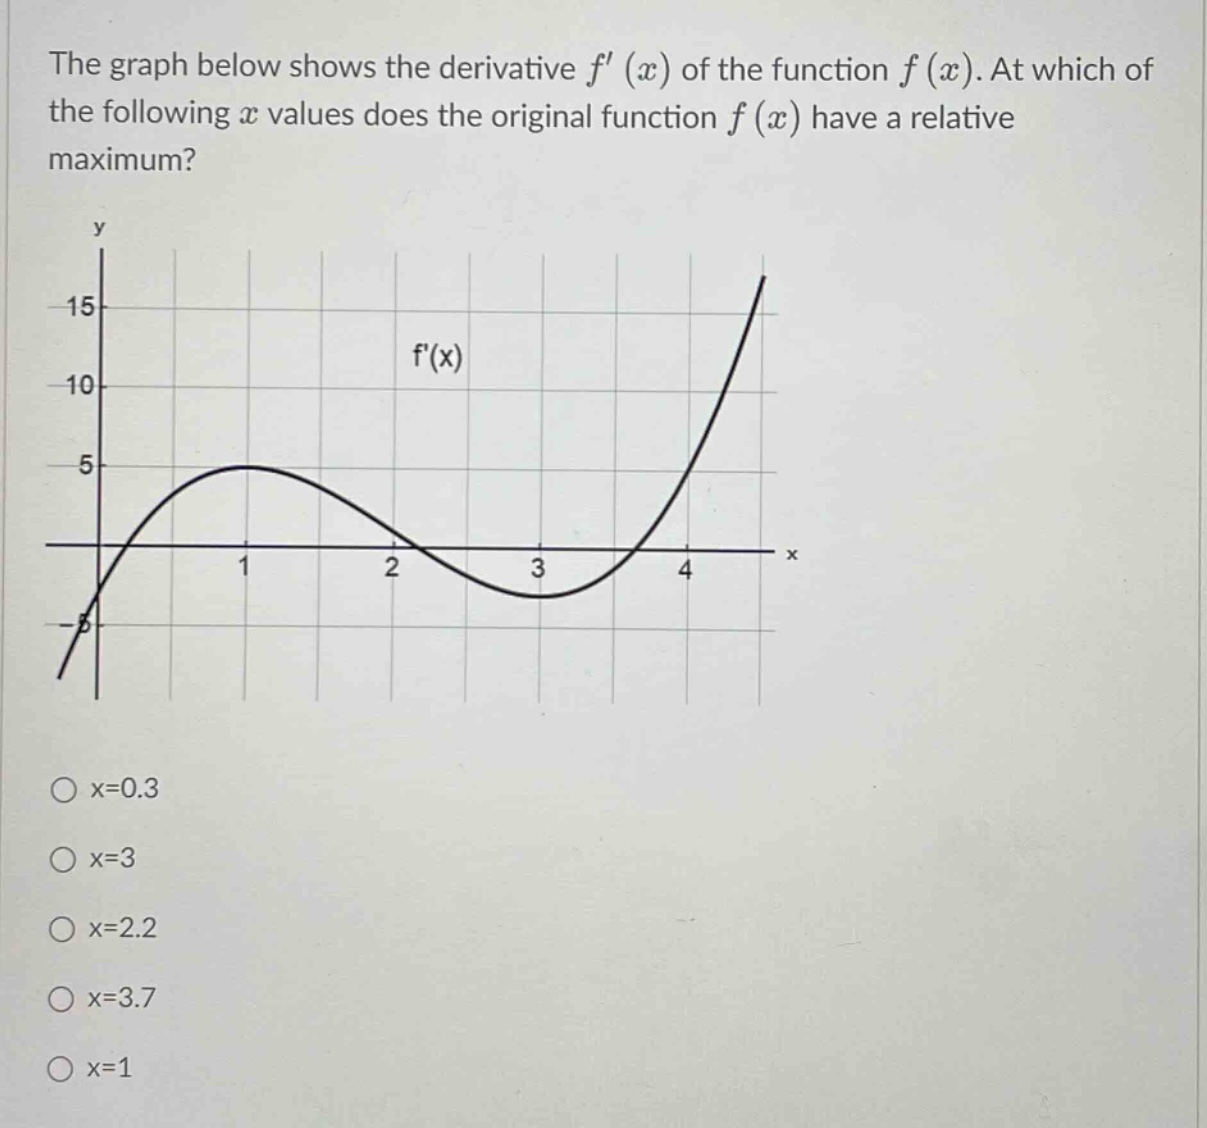
the graph below shows the derivative f (x) of the function f (x). at which of the following x values does the original function f (x) have a relative maximum? x=0.3 x=3 x=2.2 x=3.7 x=1
Answer
Explanation:
Step1: Recall the first - derivative test
A function $y = f(x)$ has a relative maximum at a point $c$ if $f^{\prime}(x)$ changes sign from positive to negative at $x = c$.
Step2: Analyze the sign of $f^{\prime}(x)$ around each option
- For $x = 0.3$, $f^{\prime}(x)>0$ and it is increasing in the neighborhood of $x = 0.3$, so it's not a relative maximum.
- For $x = 3$, $f^{\prime}(x)$ changes sign from negative to positive, so it is a relative minimum.
- For $x=2.2$, $f^{\prime}(x)$ changes sign from positive to negative. When $x$ is slightly less than $2.2$, $f^{\prime}(x)>0$ (function $f(x)$ is increasing) and when $x$ is slightly greater than $2.2$, $f^{\prime}(x)<0$ (function $f(x)$ is decreasing).
- For $x = 3.7$, $f^{\prime}(x)>0$ and the function $f(x)$ is increasing in the neighborhood of $x = 3.7$, so it's not a relative maximum.
- For $x = 1$, $f^{\prime}(x)$ is positive on both sides in a small - neighborhood, so it's not a relative maximum.
Answer:
$x = 2.2$