the graph shows the function y = sin(x) + 6 y = cos(x) - 6 y = sin(x) - 6 y = cos(x) + 6
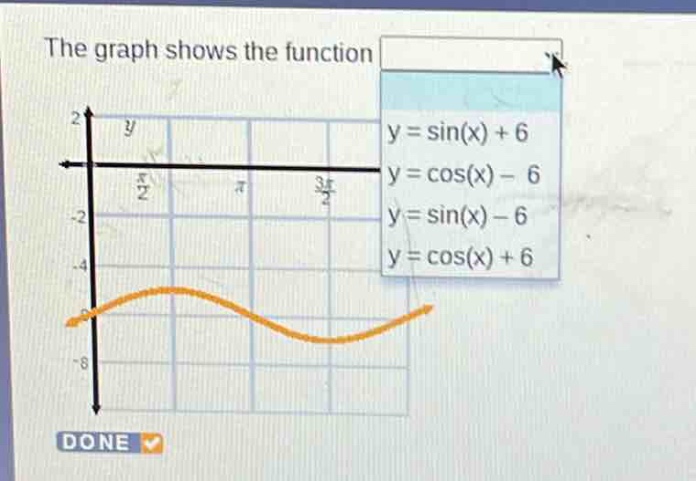
the graph shows the function y = sin(x) + 6 y = cos(x) - 6 y = sin(x) - 6 y = cos(x) + 6
Answer
Explanation:
Step1: Recall the properties of sine and cosine functions
The standard - form of sine and cosine functions are (y = A\sin(Bx - C)+D) and (y = A\cos(Bx - C)+D), where (D) is the vertical shift. The range of (y=\sin(x)) and (y = \cos(x)) is ([- 1,1]).
Step2: Analyze the vertical shift of the given graph
The graph is shifted downwards. The mid - line of the graph is around (y=-6). For (y=\sin(x)) and (y=\cos(x)), when we have a vertical shift (D), the new range is ([-1 + D,1 + D]).
Step3: Check each option
For (y=\sin(x)+6), the range is ([5,7]); for (y=\cos(x)-6), the range is ([-7,-5]); for (y=\sin(x)-6), the range is ([-7,-5]); for (y=\cos(x)+6), the range is ([5,7]). The graph has a maximum value close to (-5) and a minimum value close to (-7), so the function is (y=\sin(x)-6) or (y = \cos(x)-6). Since the graph passes through ((0, - 6)) and (\sin(0)=0,\cos(0) = 1), substituting (x = 0) into (y=\sin(x)-6) gives (y=-6).
Answer:
(y=\sin(x)-6)