this graph shows the function y = sin(x) shifted units to the.
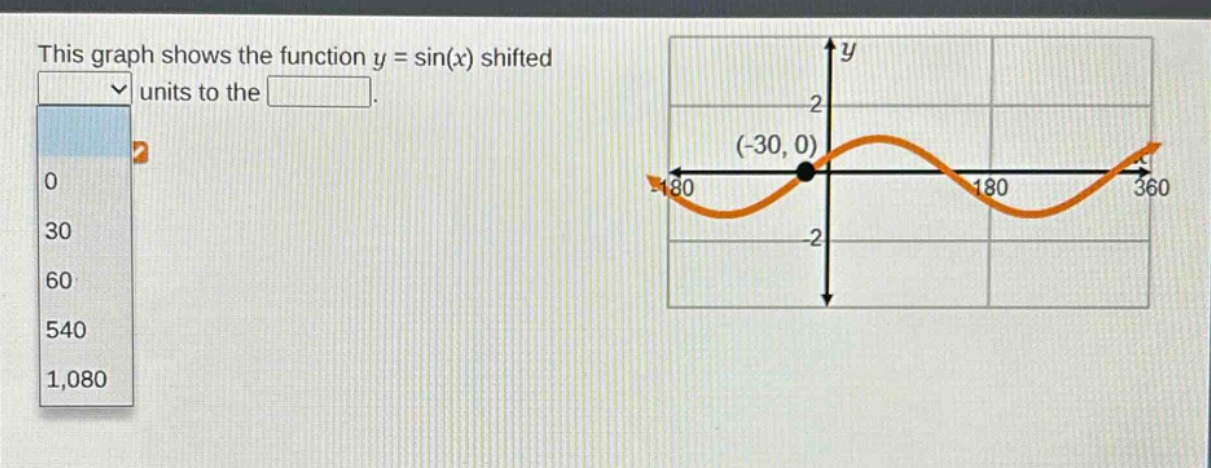
this graph shows the function y = sin(x) shifted units to the.
Answer
Answer:
30; left
Explanation:
Step1: Identify normal sine - x - intercept
The normal $y = \sin(x)$ has an x - intercept at $(0,0)$.
Step2: Determine shift
The given graph has an x - intercept at $(- 30,0)$. Since the x - value has decreased from 0 to - 30, the function $y=\sin(x)$ is shifted 30 units to the left.