the graph shows the height h (in ft) of a roller coaster t seconds after the ride starts. part 1 of 4 (a)…
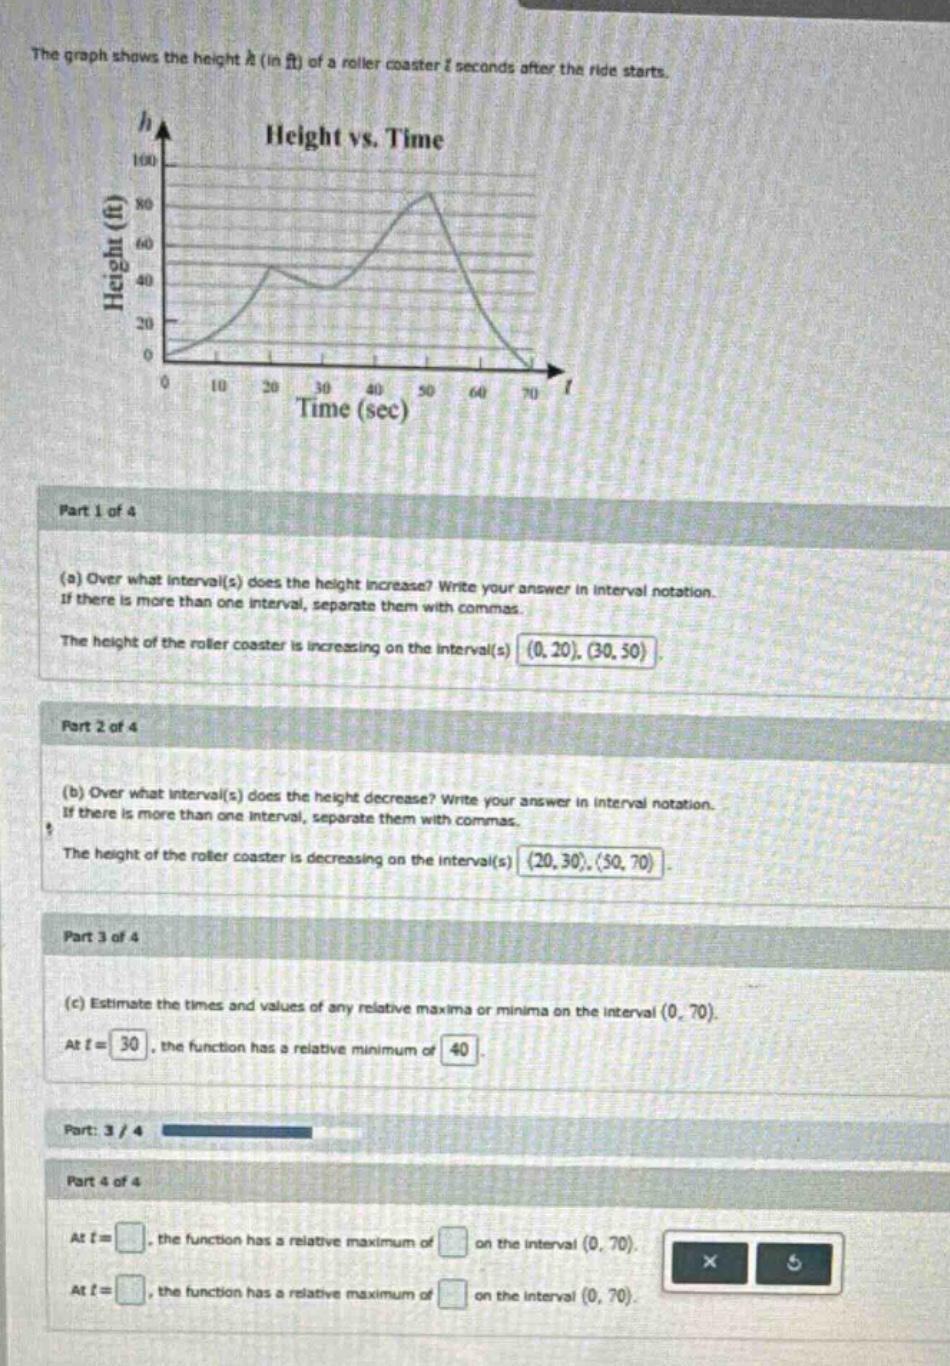
the graph shows the height h (in ft) of a roller coaster t seconds after the ride starts. part 1 of 4 (a) over what interval(s) does the height increase? write your answer in interval notation. if there is more than one interval, separate them with commas. the height of the roller coaster is increasing on the interval(s) (0, 20), (30, 50). part 2 of 4 (b) over what interval(s) does the height decrease? write your answer in interval notation. if there is more than one interval, separate them with commas. the height of the roller coaster is decreasing on the interval(s) (20, 30), (50, 70). part 3 of 4 (c) estimate the times and values of any relative maxima or minima on the interval (0, 70). at t = 30, the function has a relative minimum of 40. part 4 of 4 at t =, the function has a relative maximum of on the interval (0, 70). at t =, the function has a relative maximum of on the interval (0, 70).
Answer
Explanation:
Step1: Identify relative maxima
Look for the peaks on the graph in the interval $(0,70)$.
Step2: Estimate time and value
The main peak occurs around $t = 50$ and the height at that point is approximately $80$.
Answer:
At $t = 50$, the function has a relative maximum of $80$ on the interval $(0,70)$.