the graph shows the height, in inches, of the avocado tree. a(t) 16 14 12 10 height (inches) 8 6 4 2 0 -2…
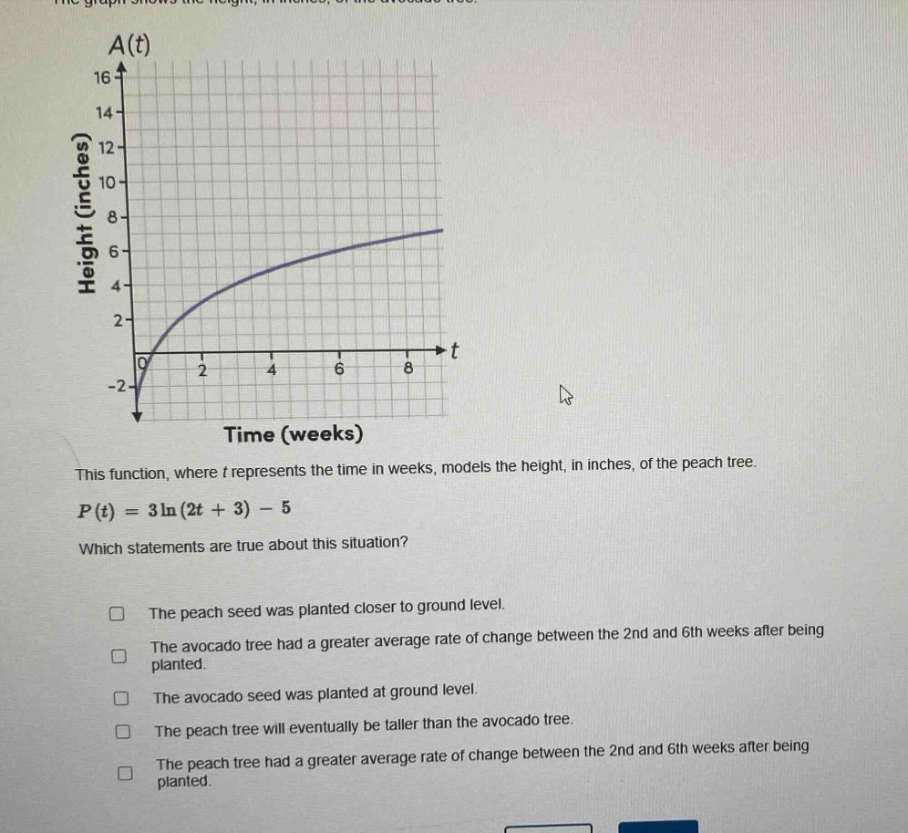
the graph shows the height, in inches, of the avocado tree. a(t) 16 14 12 10 height (inches) 8 6 4 2 0 -2 time (weeks) this function, where t represents the time in weeks, models the height, in inches, of the peach tree. p(t)=3ln(2t + 3)-5 which statements are true about this situation? the peach seed was planted closer to ground level. the avocado tree had a greater average rate of change between the 2nd and 6th weeks after being planted. the avocado seed was planted at ground level. the peach tree will eventually be taller than the avocado tree. the peach tree had a greater average rate of change between the 2nd and 6th weeks after being planted.
Answer
Explanation:
Step1: Analyze initial - height of peach tree
For the peach - tree function $P(t)=3\ln(2t + 3)-5$, when $t = 0$ (initial time), $P(0)=3\ln(3)-5\approx3\times1.099 - 5=3.297-5=-1.703$. This means the peach seed was planted below ground level (closer to ground level compared to being at ground level), so the statement "The peach seed was planted closer to ground level" is true.
Step2: Calculate average rate of change of avocado tree
We need to estimate the height of the avocado tree $A(t)$ at $t = 2$ and $t = 6$ from the graph. Let's assume $A(2)\approx3$ and $A(6)\approx6$. The average rate of change of $A(t)$ from $t = 2$ to $t = 6$ is $\frac{A(6)-A(2)}{6 - 2}=\frac{6 - 3}{4}=\frac{3}{4}=0.75$.
Step3: Calculate average rate of change of peach tree
For the peach - tree function $P(t)=3\ln(2t + 3)-5$, $P(2)=3\ln(2\times2 + 3)-5=3\ln(7)-5\approx3\times1.946-5=5.838 - 5 = 0.838$, and $P(6)=3\ln(2\times6+3)-5=3\ln(15)-5\approx3\times2.708-5=8.124 - 5 = 3.124$. The average rate of change of $P(t)$ from $t = 2$ to $t = 6$ is $\frac{P(6)-P(2)}{6 - 2}=\frac{3.124 - 0.838}{4}=\frac{2.286}{4}=0.5715$. So the avocado tree had a greater average rate of change between the 2nd and 6th weeks, and the statement "The avocado tree had a greater average rate of change between the 2nd and 6th weeks after being planted" is true.
Step4: Analyze initial - height of avocado tree
From the graph, when $t = 0$, $A(0)=0$, so the avocado seed was planted at ground level, and the statement "The avocado seed was planted at ground level" is true.
Step5: Analyze long - term growth
As $t\to+\infty$, $\lim_{t\to+\infty}A(t)$ is a horizontal asymptote (from the graph, it seems to approach a finite value), and $\lim_{t\to+\infty}P(t)=\lim_{t\to+\infty}(3\ln(2t + 3)-5)=+\infty$. So the peach tree will eventually be taller than the avocado tree, and the statement "The peach tree will eventually be taller than the avocado tree" is true.
Answer:
The peach seed was planted closer to ground level. The avocado tree had a greater average rate of change between the 2nd and 6th weeks after being planted. The avocado seed was planted at ground level. The peach tree will eventually be taller than the avocado tree.