the graph below shows the height of a seat on a ferris wheel as the ferris wheel goes through its rotation…
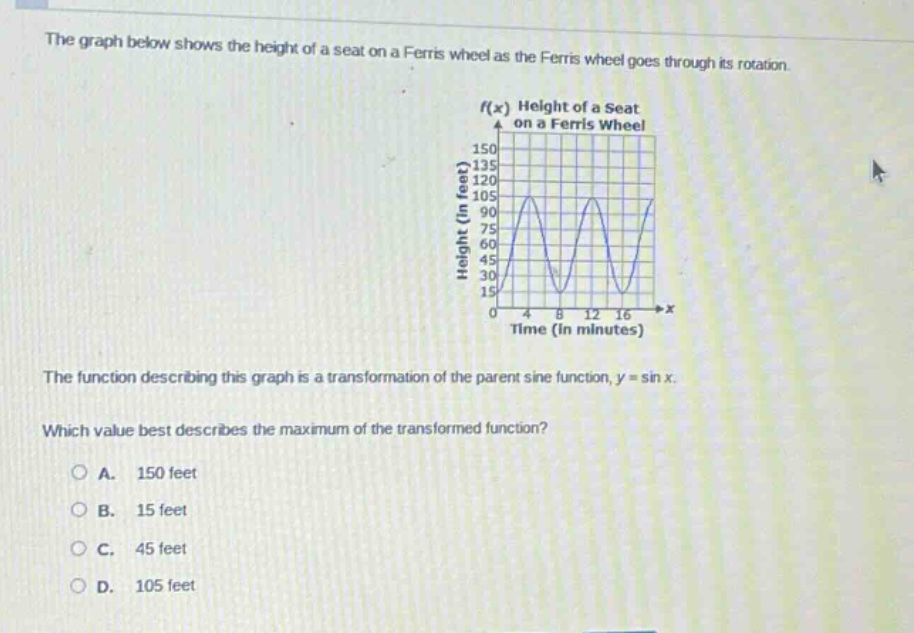
the graph below shows the height of a seat on a ferris wheel as the ferris wheel goes through its rotation. the function describing this graph is a transformation of the parent sine function, y = sin x. which value best describes the maximum of the transformed function? a. 150 feet b. 15 feet c. 45 feet d. 105 feet
Answer
Explanation:
Step1: Observe the graph
Look at the highest - point on the graph of the function (y = f(x)).
Step2: Identify the maximum value
The highest value of the height (on the (y) - axis) that the seat on the Ferris wheel reaches is 105 feet.
Answer:
D. 105 feet