the graph shows the monthly rainfall totals for a city over a two - year period. the function describing…
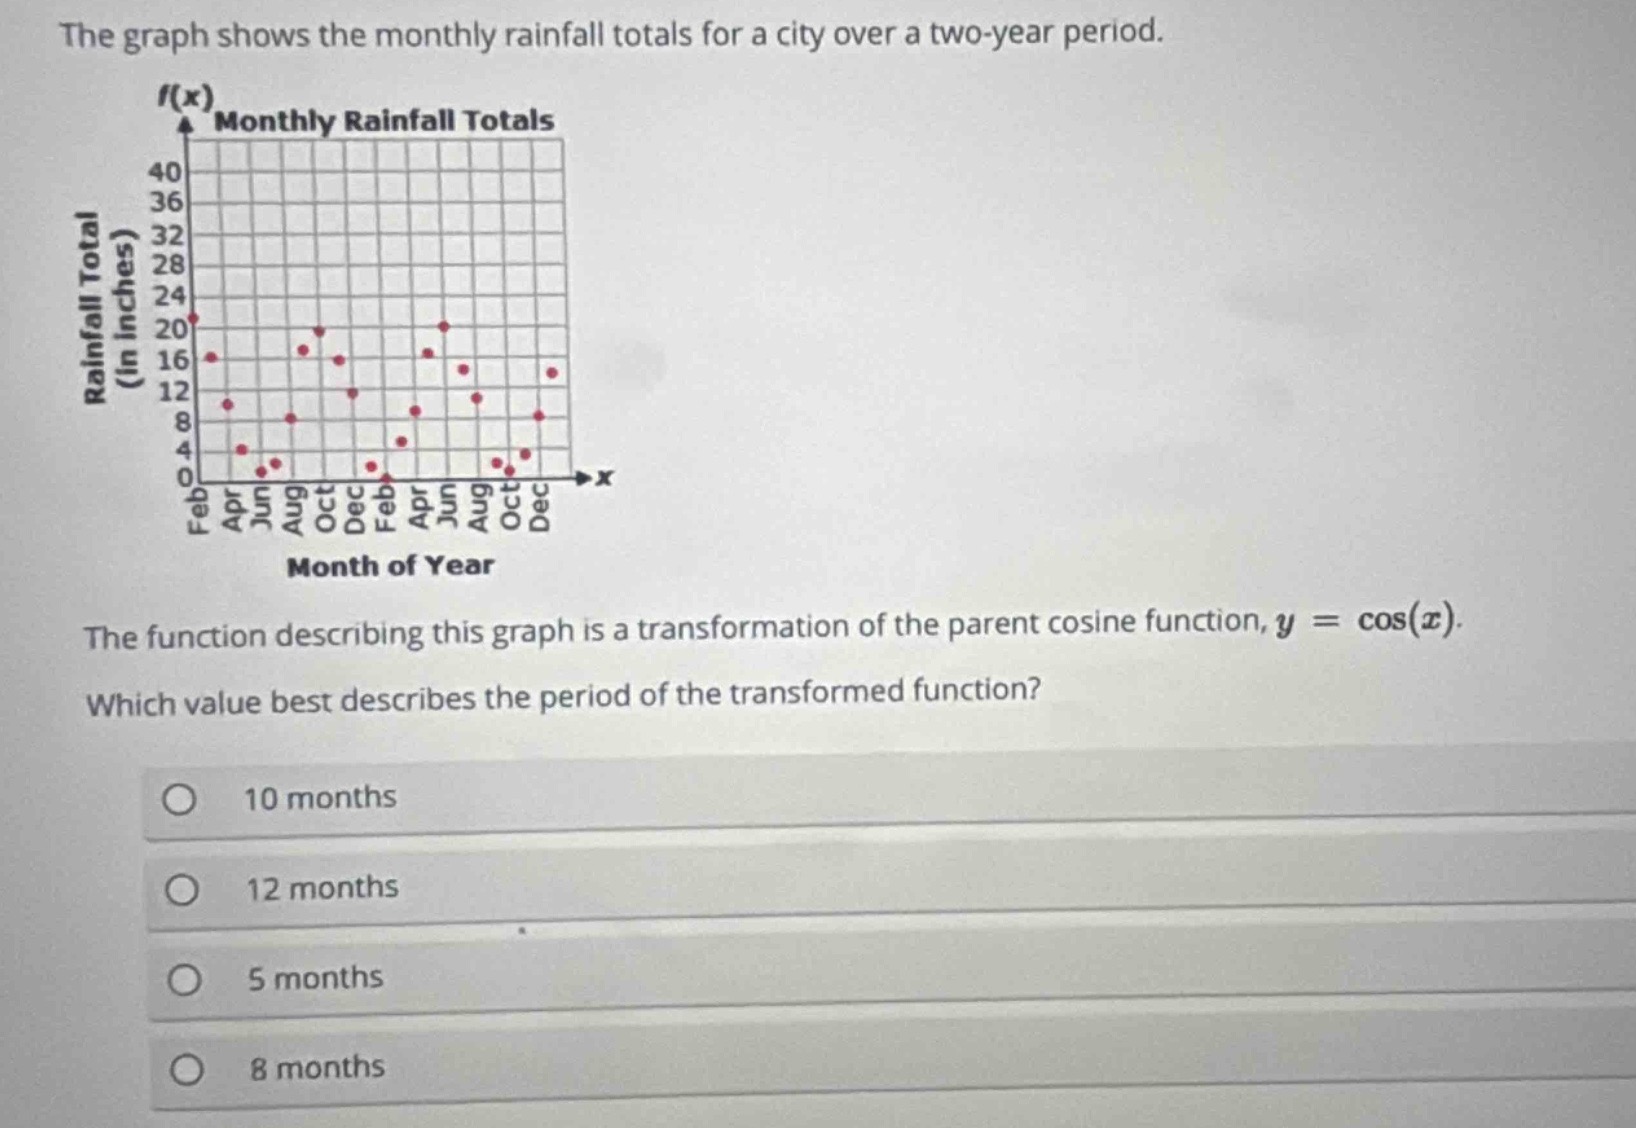
the graph shows the monthly rainfall totals for a city over a two - year period. the function describing this graph is a transformation of the parent cosine function, $y = \\cos(x)$. which value best describes the period of the transformed function? 10 months 12 months 5 months 8 months
Answer
Explanation:
Step1: Recall period definition
The period of a periodic - function is the interval after which the function repeats its values.
Step2: Analyze the graph
The graph shows the monthly rainfall totals for a two - year period. The pattern of rainfall repeats every 12 months. For example, the rainfall amounts for February of the first year and February of the second year follow a similar pattern, as do the other months. This indicates that the function representing the rainfall has a period of 12 months.
Answer:
12 months