the graph below shows how much population in thousands, y, is declining over the years since 1990, x. what…
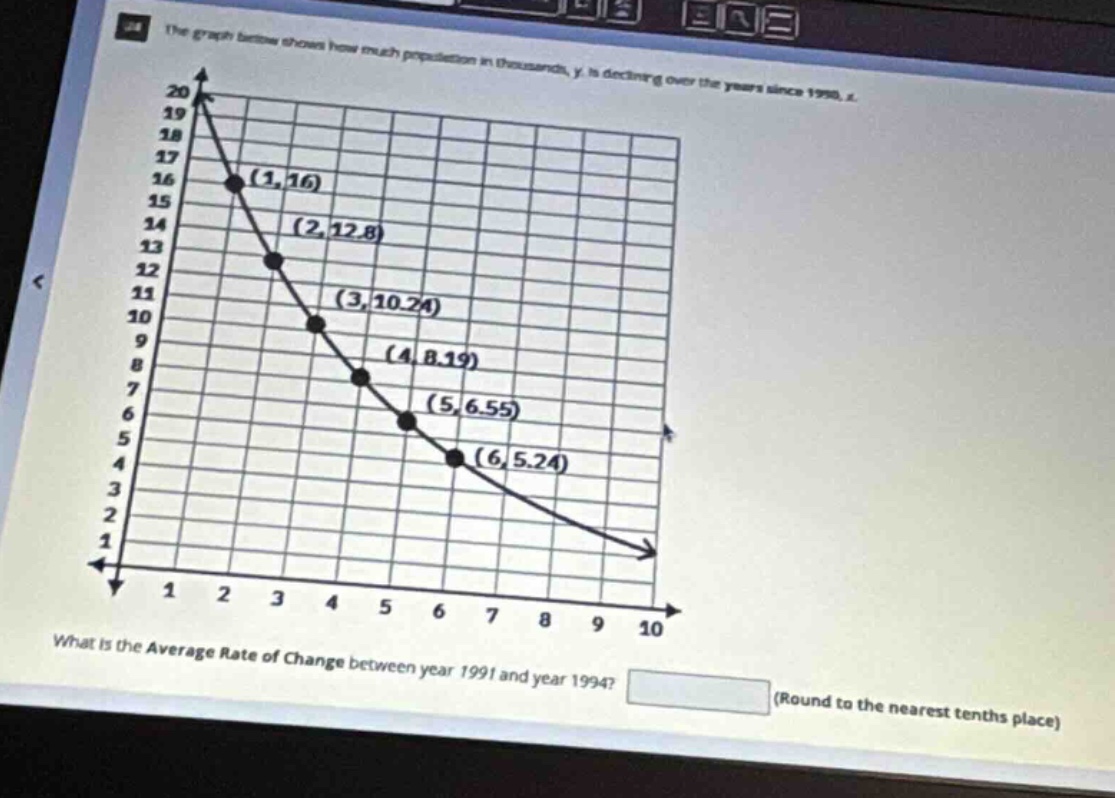
the graph below shows how much population in thousands, y, is declining over the years since 1990, x. what is the average rate of change between year 1991 and year 1994? (round to the nearest tenths place)
Answer
Explanation:
Step1: Identify the points
In 1991 ($x = 1$), $y = 16$; in 1994 ($x = 4$), $y = 8.19$.
Step2: Use the average - rate - of - change formula
The formula for the average rate of change of a function $y = f(x)$ from $x_1$ to $x_2$ is $\frac{f(x_2)-f(x_1)}{x_2 - x_1}$. Here, $x_1 = 1$, $x_2=4$, $y_1 = 16$, $y_2 = 8.19$. So the average rate of change is $\frac{8.19 - 16}{4 - 1}$.
Step3: Calculate the value
$\frac{8.19 - 16}{4 - 1}=\frac{- 7.81}{3}\approx - 2.6$.
Answer:
$-2.6$