7. the graph shows the number of patients with an infectious disease over 15 weeks. a. give an example of a…
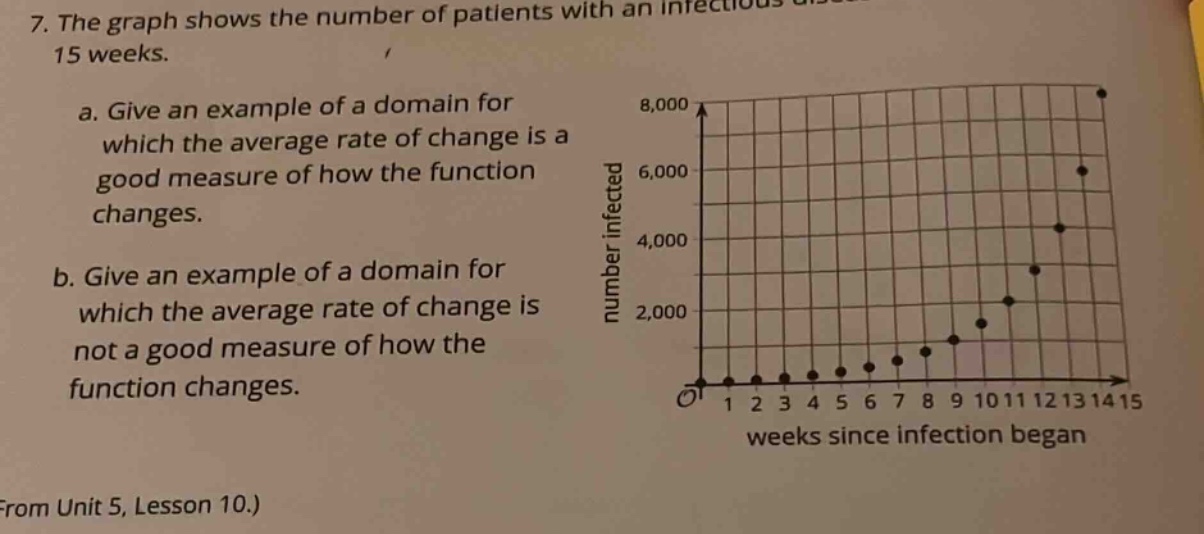
7. the graph shows the number of patients with an infectious disease over 15 weeks. a. give an example of a domain for which the average rate of change is a good measure of how the function changes. b. give an example of a domain for which the average rate of change is not a good measure of how the function changes. (from unit 5, lesson 10.)
Answer
Explanation:
Step1: Understand average rate of change
The average rate of change of a function over an interval ([a,b]) is (\frac{f(b)-f(a)}{b - a}). It is a good measure when the function changes linearly or smoothly over the interval.
Step2: Find a good - domain example
For a domain where the function changes smoothly, we can choose an interval where the points on the graph seem to follow a relatively straight - line pattern. For example, the interval ([9,11]). In this interval, the number of infected patients seems to increase in a somewhat linear fashion.
Step3: Find a bad - domain example
The average rate of change is not a good measure when the function has a lot of non - linear behavior in the interval. For example, the interval ([1,15]). Over this long interval, the function has a very slow start, then a rapid increase, and the pattern is not consistent.
Answer:
a. ([9,11]) b. ([1,15])