which graph shows a periodic function with an amplitude of 2?
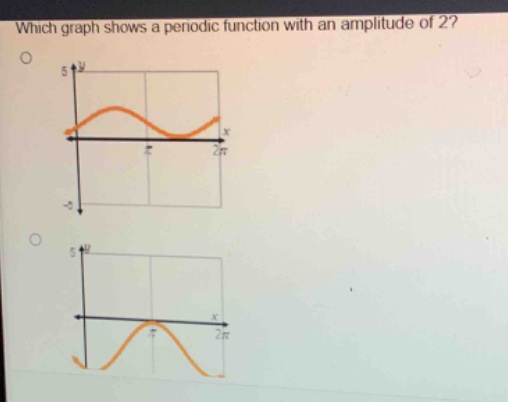
which graph shows a periodic function with an amplitude of 2?
Answer
- Recall the definition of the amplitude of a periodic - function:
- The amplitude of a periodic function (y = A\sin(Bx - C)+D) or (y = A\cos(Bx - C)+D) is given by (|A|). Geometrically, the amplitude is half of the vertical distance between the maximum and minimum values of the function. That is, (A=\frac{\text{Max}-\text{Min}}{2}).
- Analyze the first graph:
- Let's assume the general form of a periodic function (y = f(x)). For the first graph, if we observe the vertical range of the function, assume the maximum value (y_{max}) and minimum value (y_{min}). If we consider the center - line of the wave (the horizontal line about which the wave oscillates), and measure the distance from the center - line to the maximum (or minimum) value. Suppose the center - line is (y = 0). If the maximum value (y_{max}) is around (2) and the minimum value (y_{min}) is around (- 2), then the amplitude (A=\frac{2-(-2)}{2}=\frac{4}{2}=2).
- Analyze the second graph:
- For the second graph, assume the center - line is (y = 0). If we measure the vertical distance from the center - line to the maximum (or minimum) value of the function, the maximum value (y_{max}) is around (1) and the minimum value (y_{min}) is around (-1). Then the amplitude (A=\frac{1 - (-1)}{2}=\frac{2}{2}=1).
Answer: The first graph
Explanation:
Step1: Recall amplitude formula
(A=\frac{\text{Max}-\text{Min}}{2})
Step2: Analyze first graph
Max is 2, Min is - 2, (A = 2)
Step3: Analyze second graph
Max is 1, Min is - 1, (A = 1)