the graph shows the quadratic function f(x). what is the average rate of change for the quadratic function…
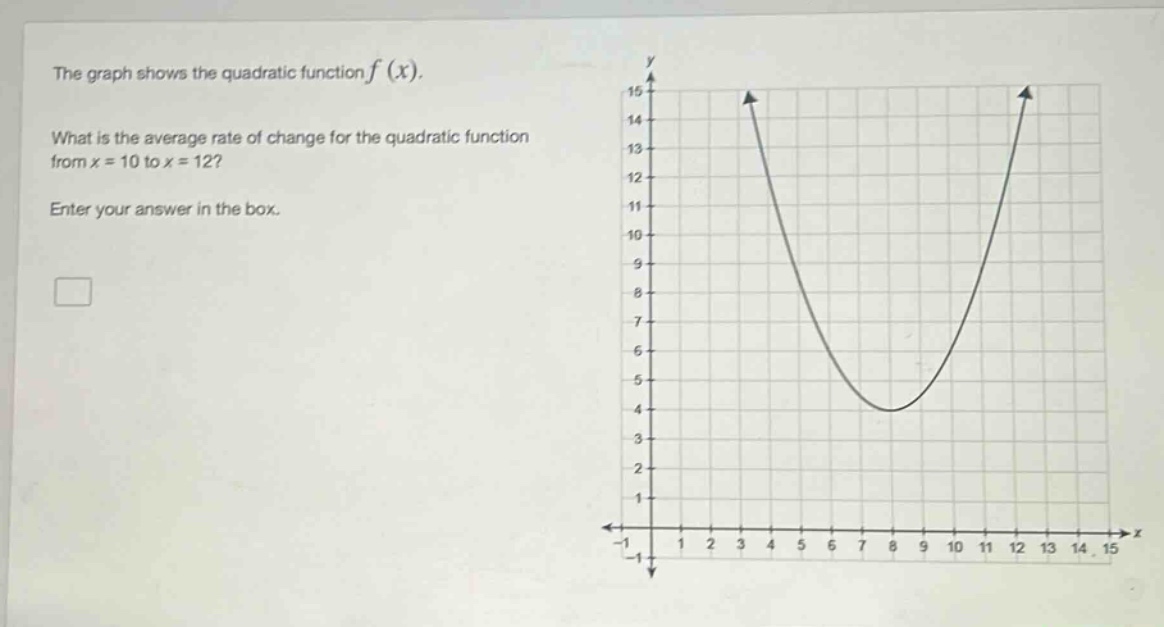
the graph shows the quadratic function f(x). what is the average rate of change for the quadratic function from x = 10 to x = 12? enter your answer in the box.
Answer
Answer:
5
Explanation:
Step1: Recall average - rate - of - change formula
The average rate of change of a function $y = f(x)$ from $x=a$ to $x = b$ is $\frac{f(b)-f(a)}{b - a}$. Here, $a = 10$ and $b=12$.
Step2: Estimate function values from graph
By looking at the graph, when $x = 10$, $f(10)=9$ (estimated value by finding the $y$ - coordinate on the graph at $x = 10$). When $x = 12$, $f(12)=19$ (estimated value by finding the $y$ - coordinate on the graph at $x = 12$).
Step3: Calculate average rate of change
Substitute into the formula: $\frac{f(12)-f(10)}{12 - 10}=\frac{19 - 9}{2}=\frac{10}{2}=5$.