the graph shows the side view of a waterslide. dimensions are in feet. two points on slide: (0, 80), (5, 40)…
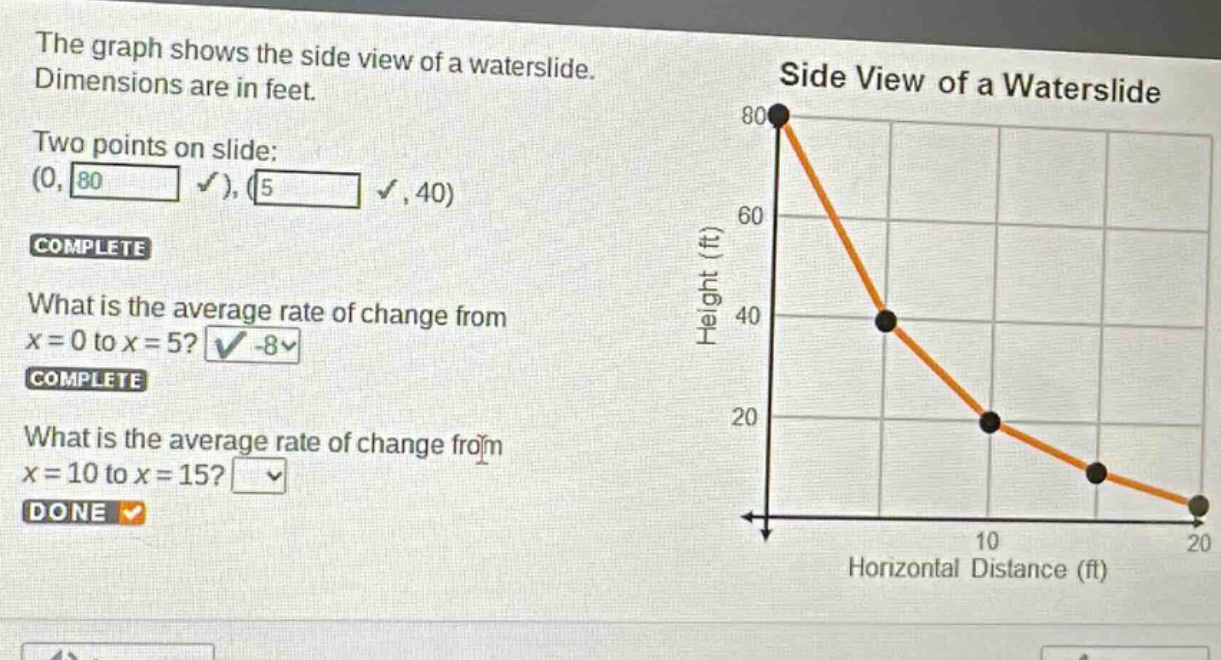
the graph shows the side view of a waterslide. dimensions are in feet. two points on slide: (0, 80), (5, 40) complete what is the average rate of change from x = 0 to x = 5? -8 complete what is the average rate of change from x = 10 to x = 15? done
Answer
Explanation:
Step1: Identify the formula for average rate of change
The formula for the average rate of change of a function $y = f(x)$ from $x = a$ to $x = b$ is $\frac{f(b)-f(a)}{b - a}$.
Step2: Determine the points for $x = 10$ and $x = 15$
From the graph, when $x = 10$, $y = 20$ and when $x = 15$, $y = 10$.
Step3: Calculate the average rate of change
Using the formula $\frac{f(15)-f(10)}{15 - 10}=\frac{10 - 20}{15 - 10}=\frac{- 10}{5}=-2$.
Answer:
-2