the graph below shows the speed in miles per hour of a car on a country road over a 3 - second interval…
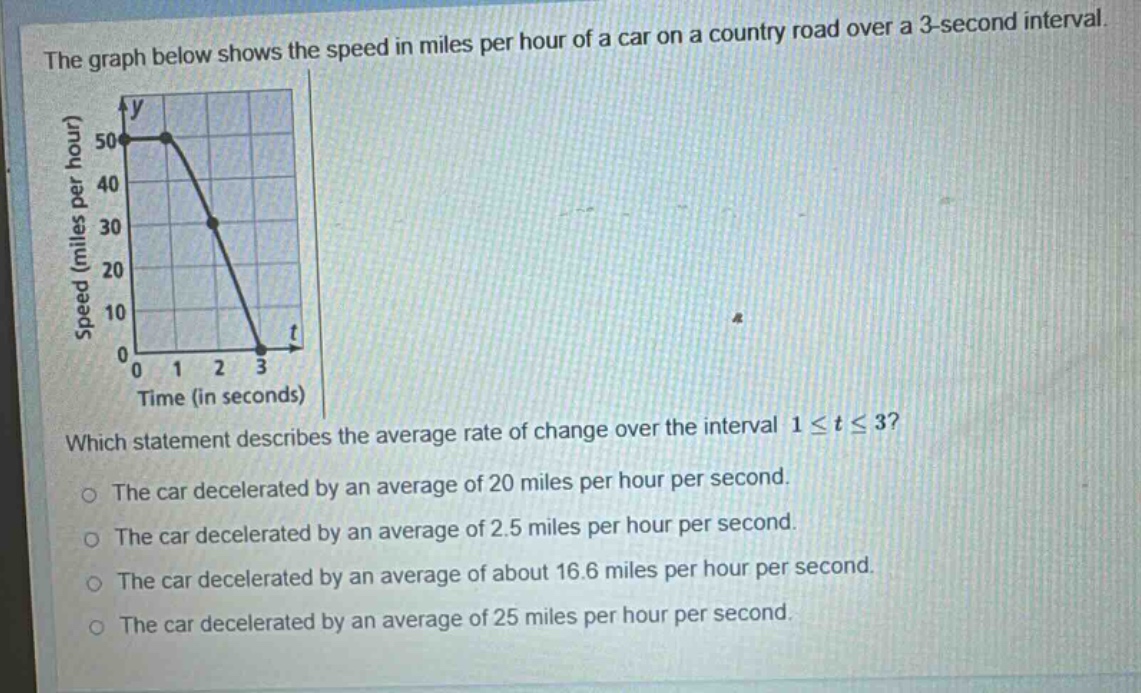
the graph below shows the speed in miles per hour of a car on a country road over a 3 - second interval. which statement describes the average rate of change over the interval 1 ≤ t ≤ 3? the car decelerated by an average of 20 miles per hour per second. the car decelerated by an average of 2.5 miles per hour per second. the car decelerated by an average of about 16.6 miles per hour per second. the car decelerated by an average of 25 miles per hour per second.
Answer
Explanation:
Step1: Identify the formula for average rate of change
The formula for the average rate of change of a function $y = f(t)$ over the interval $[a,b]$ is $\frac{f(b)-f(a)}{b - a}$. Here, $a = 1$, $b=3$, and $y$ represents speed in miles - per - hour and $t$ represents time in seconds.
Step2: Determine the speed values at $t = 1$ and $t = 3$
From the graph, when $t = 1$, the speed $y_1=50$ miles per hour, and when $t = 3$, the speed $y_2 = 0$ miles per hour.
Step3: Calculate the average rate of change
Substitute the values into the formula: $\frac{y_2 - y_1}{3 - 1}=\frac{0 - 50}{2}=\frac{- 50}{2}=-25$ miles per hour per second. The negative sign indicates deceleration.
Answer:
The car decelerated by an average of 25 miles per hour per second.