graph the trigonometric function. y = 1/3 sec(1/2 x) start by drawing three consecutive asymptotes. then…
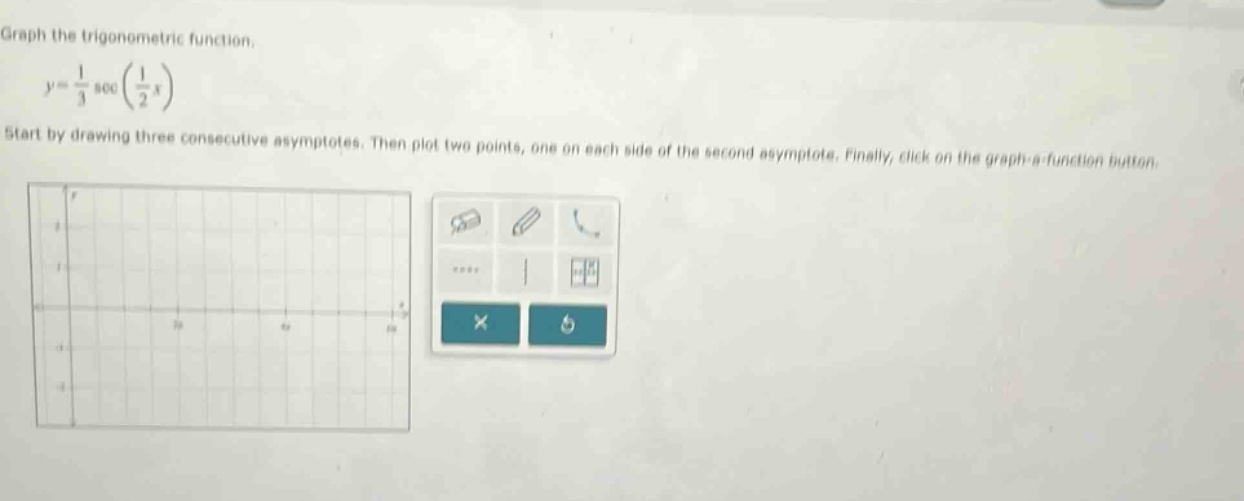
graph the trigonometric function. y = 1/3 sec(1/2 x) start by drawing three consecutive asymptotes. then plot two points, one on each side of the second asymptote. finally, click on the graph - a - function button.
Answer
Explanation:
Step1: Recall secant - asymptote formula
The secant function (y = A\sec(Bx - C)+D) has asymptotes where (\cos(Bx - C)=0). For (y=\frac{1}{3}\sec(\frac{1}{2}x)), (A = \frac{1}{3}), (B=\frac{1}{2}), (C = 0), (D = 0). The equation (\cos(\frac{1}{2}x)=0) gives (\frac{1}{2}x=(2n + 1)\frac{\pi}{2}), so (x=(2n + 1)\pi). For (n = 0), (x=\pi); for (n = 1), (x = 3\pi); for (n=- 1), (x=-\pi). These are three consecutive asymptotes.
Step2: Find points on either side of the second asymptote ((x = 3\pi))
Let's first find the period of (y=\frac{1}{3}\sec(\frac{1}{2}x)). The period of (y = A\sec(Bx - C)+D) is (T=\frac{2\pi}{|B|}), so (T = \frac{2\pi}{\frac{1}{2}}=4\pi). We can find points by choosing (x) - values near (x = 3\pi). When (x=\frac{5\pi}{2}), (y=\frac{1}{3}\sec(\frac{1}{2}\times\frac{5\pi}{2})=\frac{1}{3}\sec(\frac{5\pi}{4})=\frac{1}{3}\times(-\sqrt{2})=-\frac{\sqrt{2}}{3}). When (x=\frac{7\pi}{2}), (y=\frac{1}{3}\sec(\frac{1}{2}\times\frac{7\pi}{2})=\frac{1}{3}\sec(\frac{7\pi}{4})=\frac{1}{3}\times\sqrt{2}=\frac{\sqrt{2}}{3}). Then, we can use these asymptotes and points to graph the function (y=\frac{1}{3}\sec(\frac{1}{2}x)) on a coordinate - plane.
Answer:
Graph the asymptotes (x =-\pi), (x=\pi), (x = 3\pi) and the points ((\frac{5\pi}{2},-\frac{\sqrt{2}}{3})) and ((\frac{7\pi}{2},\frac{\sqrt{2}}{3})) to sketch the graph of (y=\frac{1}{3}\sec(\frac{1}{2}x)).