the graphs of the functions g and h are shown below. for each graph, find the absolute maximum and absolute…
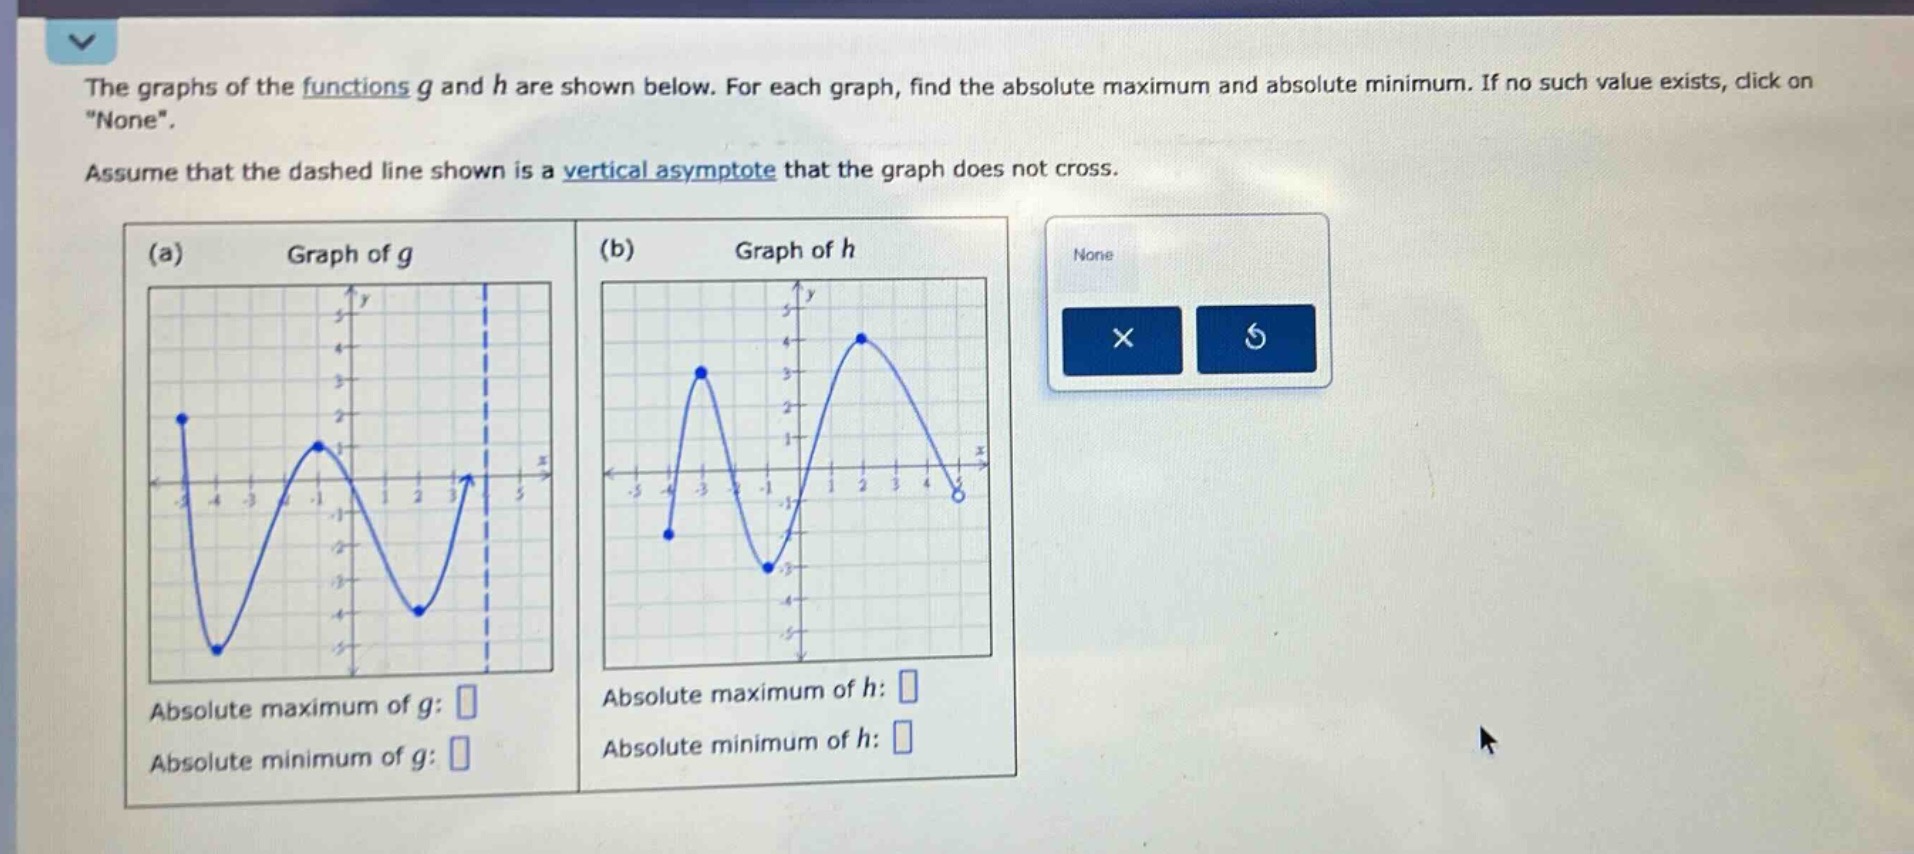
the graphs of the functions g and h are shown below. for each graph, find the absolute maximum and absolute minimum. if no such value exists, click on “none”. assume that the dashed line shown is a vertical asymptote that the graph does not cross. (a) graph of g (b) graph of h absolute maximum of g: absolute minimum of g: absolute maximum of h: absolute minimum of h:
Answer
Explanation:
Step1: Analyze graph of (g) for maximum
Look for highest (y - )value. The highest point on graph of (g) has (y = 2).
Step2: Analyze graph of (g) for minimum
Look for lowest (y - )value. The lowest point on graph of (g) has (y=-4).
Step3: Analyze graph of (h) for maximum
Look for highest (y - )value. The highest points on graph of (h) have (y = 4).
Step4: Analyze graph of (h) for minimum
Look for lowest (y - )value. The lowest point on graph of (h) has (y=-3).
Answer:
Absolute maximum of (g): (2) Absolute minimum of (g): (-4) Absolute maximum of (h): (4) Absolute minimum of (h): (-3)