7) here are the graphs of the population of two fast growing cities p and q, which can be modeled using the…
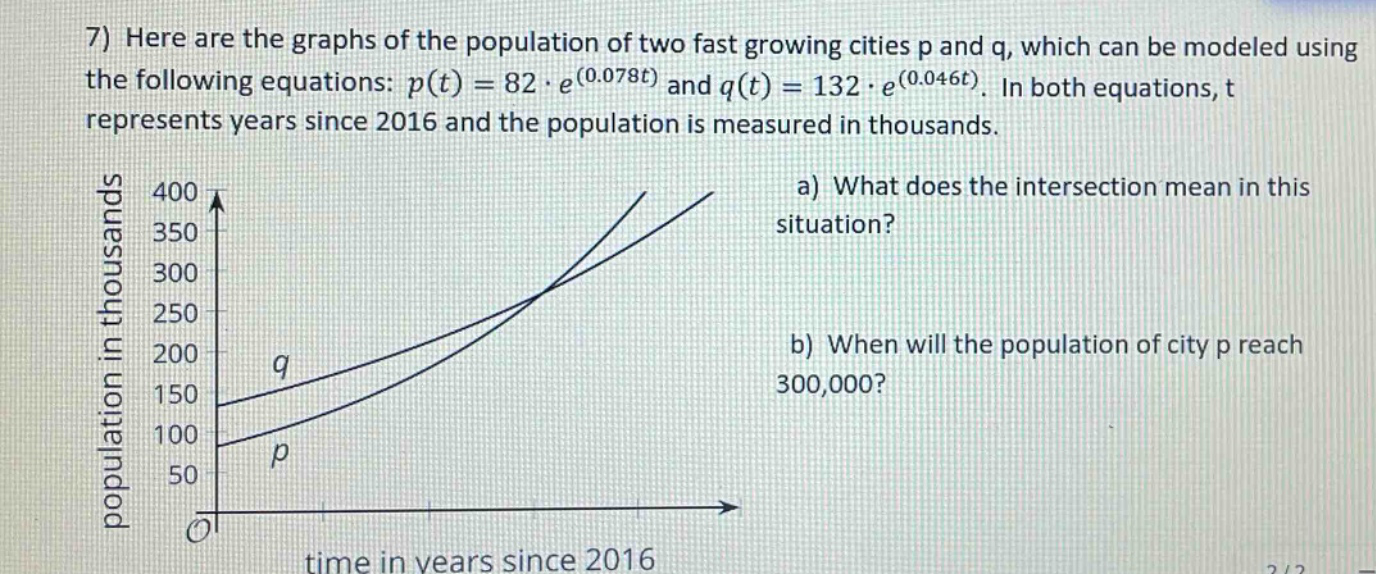
7) here are the graphs of the population of two fast growing cities p and q, which can be modeled using the following equations: p(t)=82·e^(0.078t) and q(t)=132·e^(0.046t). in both equations, t represents years since 2016 and the population is measured in thousands. a) what does the intersection mean in this situation? b) when will the population of city p reach 300,000?
Answer
Explanation:
Step1: Interpret intersection meaning
The intersection of the two curves $p(t)$ and $q(t)$ represents the year (since 2016) when the populations of cities $p$ and $q$ are equal.
Step2: Solve for $t$ when $p(t)=300$
Set $p(t) = 300$ (since population is in thousands). So, $82\cdot e^{(0.078t)}=300$. First, divide both sides by 82: $e^{(0.078t)}=\frac{300}{82}=\frac{150}{41}$. Then, take the natural - logarithm of both sides: $\ln(e^{(0.078t)})=\ln(\frac{150}{41})$. Using the property $\ln(e^x)=x$, we get $0.078t=\ln(\frac{150}{41})$. Solve for $t$: $t = \frac{\ln(\frac{150}{41})}{0.078}$. Calculate $\ln(\frac{150}{41})\approx\ln(3.6585)\approx1.296$ and $t=\frac{1.296}{0.078}\approx16.62$.
Answer:
a) The year (since 2016) when the populations of cities $p$ and $q$ are equal. b) Approximately 16.62 years after 2016.