the graphs of f, f, and f are shown below. determine which graph corresponds to each function.
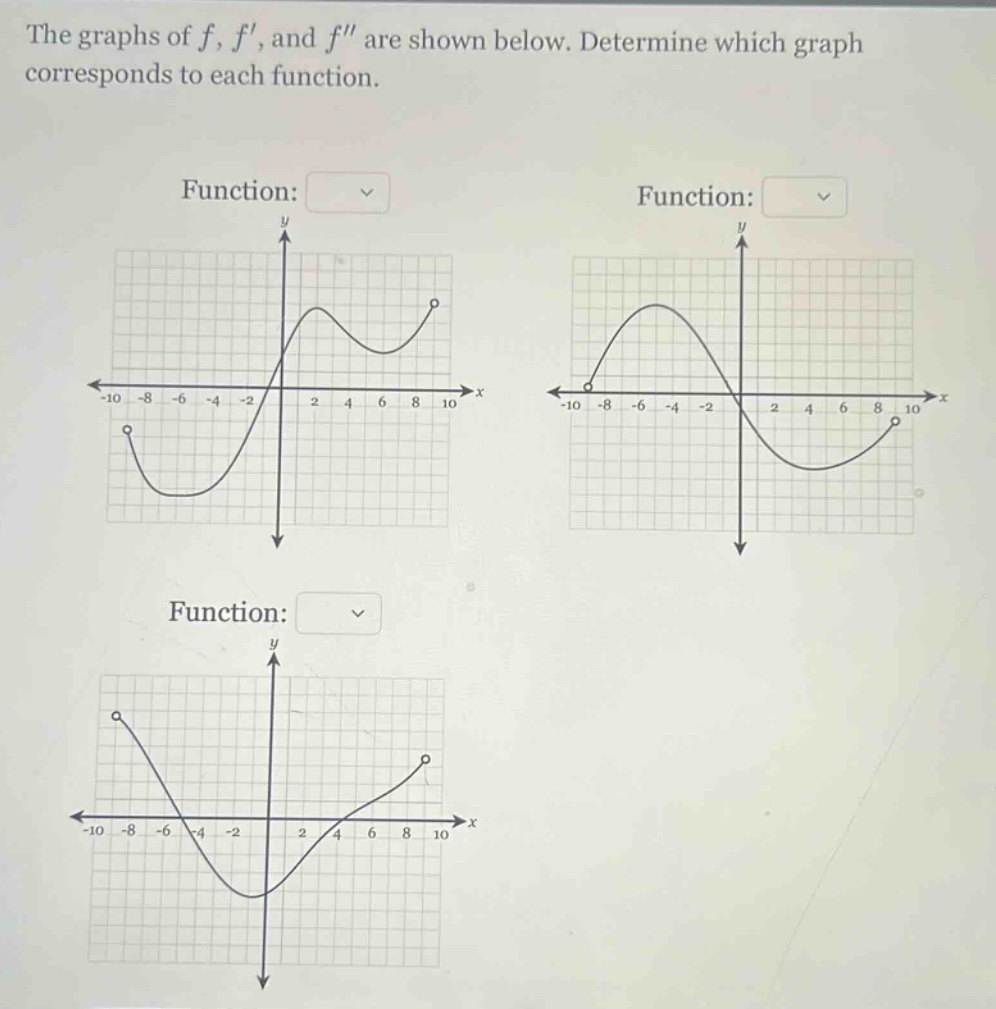
the graphs of f, f, and f are shown below. determine which graph corresponds to each function.
Answer
Explanation:
Step1: Recall derivative - graph relationships
The derivative $f'$ gives the slope of $f$. The second - derivative $f''$ gives the concavity of $f$. If $f$ is increasing, $f'>0$; if $f$ is decreasing, $f'<0$. If $f$ is concave up, $f''>0$; if $f$ is concave down, $f''<0$.
Step2: Analyze the first graph
Suppose the first graph is $y = f(x)$. It has an increasing - decreasing - increasing behavior. Its derivative $f'$ will be positive when $f$ is increasing, negative when $f$ is decreasing. The second - derivative $f''$ will change sign at the inflection points of $f$.
Step3: Analyze the second graph
If we assume the second graph is $y = f'(x)$. When $f'(x)>0$, $f(x)$ is increasing and when $f'(x)<0$, $f(x)$ is decreasing. The zeros of $f'(x)$ correspond to the local extrema of $f(x)$.
Step4: Analyze the third graph
If we assume the third graph is $y = f''(x)$. When $f''(x)>0$, $f(x)$ is concave up and when $f''(x)<0$, $f(x)$ is concave down. The zeros of $f''(x)$ correspond to the inflection points of $f(x)$. Let's assume the top - left graph is $f$, the top - right graph is $f'$, and the bottom graph is $f''$. We check the following:
- For the top - left graph ($f$): It has a local minimum and a local maximum. At the local minimum and maximum, the slope of $f$ (i.e., $f'$) is zero. The top - right graph ($f'$) crosses the $x$ - axis at the $x$ - values corresponding to the local extrema of the top - left graph ($f$).
- The concavity of the top - left graph ($f$) changes. The bottom graph ($f''$) crosses the $x$ - axis at the inflection points of the top - left graph ($f$).
Answer:
Top - left graph: $f$; Top - right graph: $f'$; Bottom graph: $f''$