hayley is growing pumpkins in her garden this summer and is so excited when the first tiny green pumpkin…
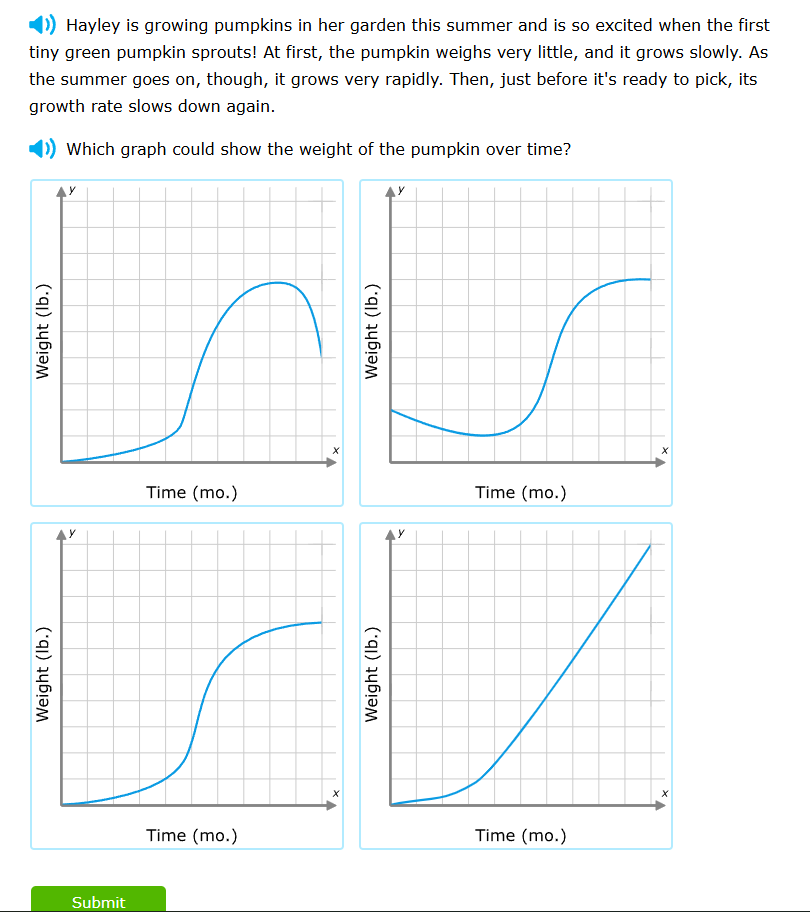
hayley is growing pumpkins in her garden this summer and is so excited when the first tiny green pumpkin sprouts! at first, the pumpkin weighs very little, and it grows slowly. as the summer goes on, though, it grows very rapidly. then, just before its ready to pick, its growth rate slows down again.\n\nwhich graph could show the weight of the pumpkin over time?
Answer
Explanation:
Step1: Analyze the initial growth phase
The problem states that at first, the pumpkin weighs very little and grows slowly. This corresponds to a graph that starts near the origin $(0,0)$ with a shallow slope (low rate of change).
Step2: Analyze the middle growth phase
The problem states that as summer goes on, it grows very rapidly. This indicates a steepening slope in the middle of the graph, representing an acceleration in weight gain.
Step3: Analyze the final growth phase
The problem states that just before it is ready to pick, the growth rate slows down again. This means the slope of the graph should flatten out (become less steep) as time progresses, though the weight remains high.
Step4: Evaluate the provided graph options
- Top-left graph: Shows weight decreasing at the end, which is unrealistic for a growing pumpkin.
- Top-right graph: Shows weight decreasing at the beginning, which contradicts the starting state.
- Bottom-left graph: Starts slow, accelerates in the middle, and levels off at the end. This matches all descriptions.
- Bottom-right graph: Shows constant rapid growth at the end without slowing down.
Answer:
The bottom-left graph.