3. the height of the ball in the graph is in interval b. mark only one oval. increasing decreasing constant…
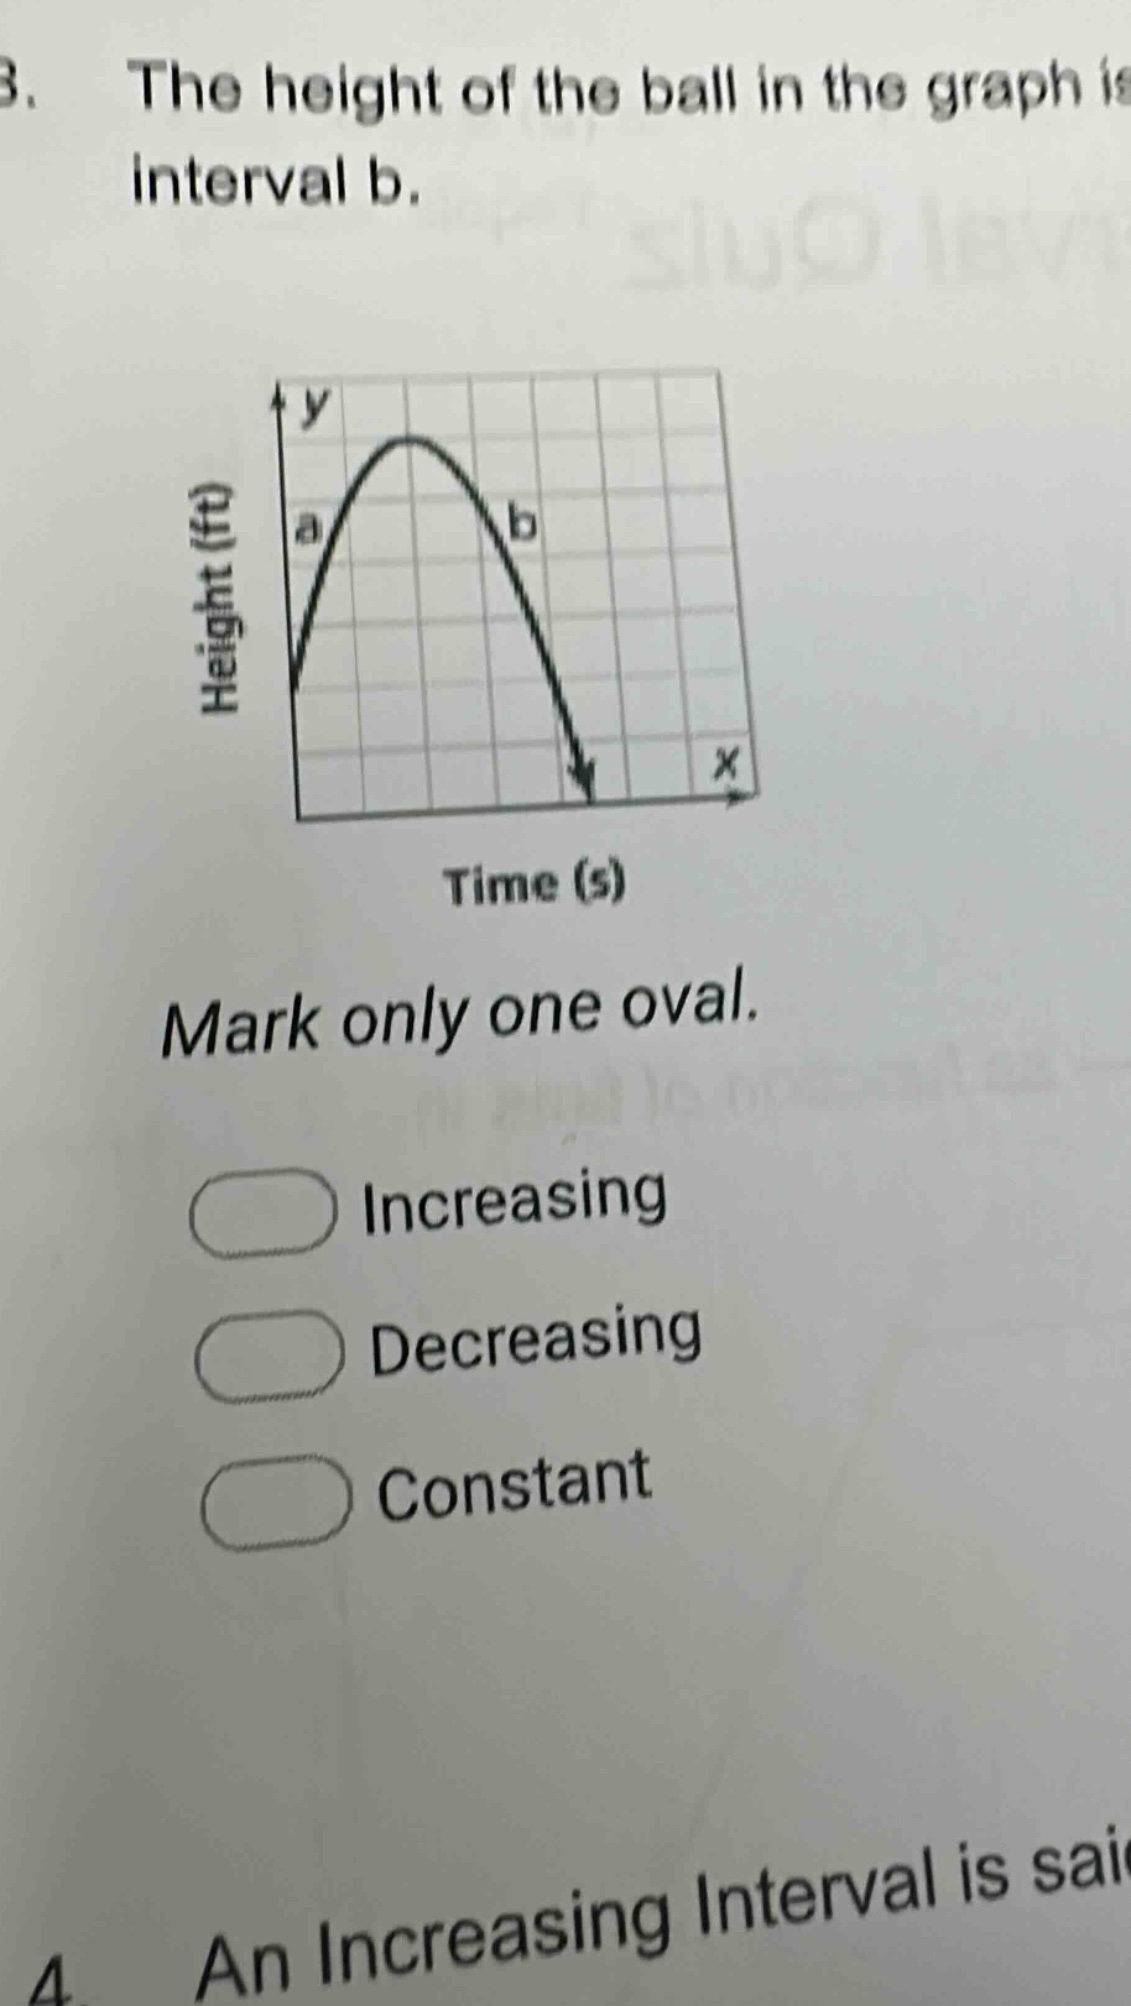
3. the height of the ball in the graph is in interval b. mark only one oval. increasing decreasing constant 4. an increasing interval is sai
Answer
Explanation:
Step1: Analyze the graph trend
In the interval b, as the value of the x - axis (time) increases, the value of the y - axis (height) is going down.
Answer:
Decreasing