the height, h, in feet of a ball suspended from a spring as a function of time, t, in seconds can be modeled…
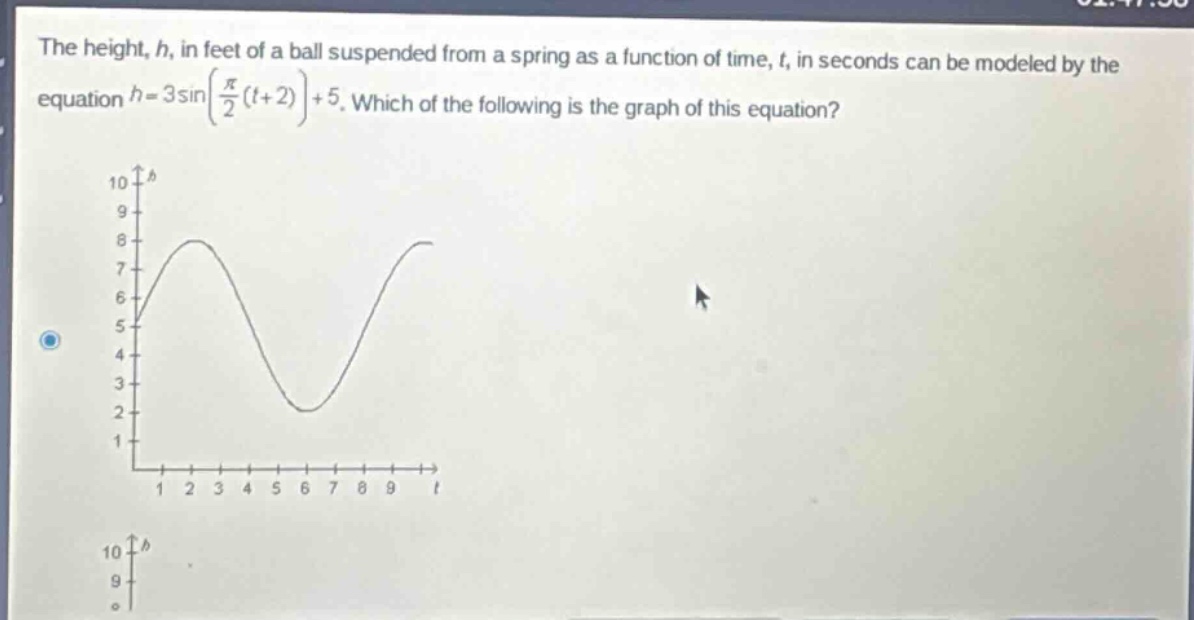
the height, h, in feet of a ball suspended from a spring as a function of time, t, in seconds can be modeled by the equation (h = 3sinleft(\frac{pi}{2}(t + 2)\right)+5). which of the following is the graph of this equation?
Answer
Explanation:
Step1: Identify the general form of a sinusoidal function
The general form of a sinusoidal function is $y = A\sin(B(x - C))+D$, where $A$ is the amplitude, $B$ affects the period ($T=\frac{2\pi}{B}$), $C$ is the phase - shift, and $D$ is the vertical shift. For the function $h = 3\sin(\frac{\pi}{2}(t + 2))+5$, we have $A = 3$, $B=\frac{\pi}{2}$, $C=- 2$, and $D = 5$.
Step2: Calculate the period
Using the formula $T=\frac{2\pi}{B}$, substituting $B=\frac{\pi}{2}$, we get $T=\frac{2\pi}{\frac{\pi}{2}}=4$.
Step3: Analyze the vertical shift
The vertical shift $D = 5$ means the graph is shifted up 5 units. The mid - line of the graph is $h = 5$.
Step4: Analyze the amplitude
The amplitude $A = 3$ means the maximum value of the function is $5 + 3=8$ and the minimum value is $5-3 = 2$.
Answer:
Based on the above - mentioned properties (period of 4, mid - line at $h = 5$, maximum of 8 and minimum of 2), the correct graph can be identified among the given options (not shown completely here, but the described characteristics should match the correct graph). Without the full set of options, we can't precisely pick one, but the graph should oscillate between $h = 2$ and $h = 8$ with a period of 4 and a mid - line at $h = 5$.